Exam 22: understanding Graphs
Exam 1: The Art and Science of Economic Analysis162 Questions
Exam 2: Economic Tools and Economics Systems198 Questions
Exam 3: Economic Decision Makers207 Questions
Exam 4: Demand, supply, and Markets239 Questions
Exam 5: Introduction to Macroeconomics165 Questions
Exam 6: Tracking the Useconomy206 Questions
Exam 7: Unemployment and Inflation208 Questions
Exam 8: Productivity and Growth123 Questions
Exam 9: Aaggregate Expenditure and Aggregate Demand169 Questions
Exam 10: Baggregate Expenditure and Aggregate Demand144 Questions
Exam 11: Aggregate Supply211 Questions
Exam 12: Fiscal Policy169 Questions
Exam 13: Federal Budgets and Public Policy161 Questions
Exam 14: Money and the Financial System212 Questions
Exam 15: Banking and the Money Supply234 Questions
Exam 16: Monetary Theory and Policy198 Questions
Exam 17: Macro Policy Debate: Active or Passive198 Questions
Exam 18: International Trade160 Questions
Exam 19: Externalities and the Environment201 Questions
Exam 20: International Finance232 Questions
Exam 21: Economic Development97 Questions
Exam 22: understanding Graphs73 Questions
Exam 23: National Income Accounts20 Questions
Exam 24: The Algebra of Demand-Side Equilibrium72 Questions
Select questions type
Exhibit 1-14 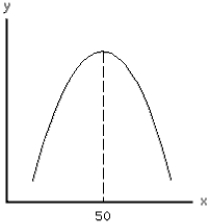 -Using Exhibit 1-14,calculate the slope of the curve where x equals 50.
Free
(Multiple Choice)
4.9/5  (42)
(42)
Correct Answer: Verified
A
The statement that there is an inverse relationship between x and y means that
Free
(Multiple Choice)
4.9/5 (31)
Correct Answer:Verified
C
A functional relationship exists between two variables if the value of one variable depends on the value of the other variable.
(True/False)
4.9/5 (39)
If slope = 2 for a line on a graph with x on the horizontal axis and y on the vertical axis,then if
(Multiple Choice)
5.0/5 (36)
Suppose a graph with Ron's weight on the vertical axis and his consumption of ice cream on the horizontal axis indicated that for each serving of ice cream he ate,Ron would gain 3 pounds,regardless of how much ice cream he had already eaten.This graph would show a
(Multiple Choice)
4.7/5 (43)
Exhibit 1-1 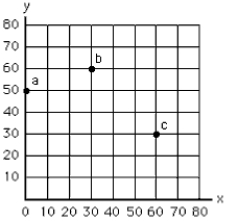 -In Exhibit 1-1 the movement from point b to point c represents
(Multiple Choice)
4.9/5 (38)
Exhibit 1-5 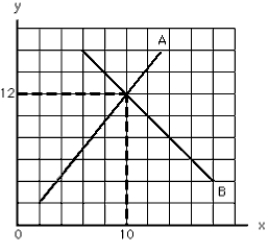 -In Exhibit 1-5,curve B has a __________ slope that is __________ at every point.
(Multiple Choice)
4.9/5 (37)
Exhibit 1-4 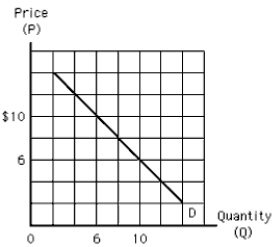 -Which of the following must be true of line D in Exhibit 1-4?
(Multiple Choice)
4.9/5 (40)
Moderate exercise is better than none,but excessive exercise is harmful.What is the shape of the graph of health benefits versus hours of exercise per week if health benefits are measured on the vertical axis and exercise is measured on the horizontal axis?
(Multiple Choice)
4.8/5 (43)
Exhibit 1-5
-In Exhibit 1-5,curve A has a __________ slope that is __________ at every point.
(Multiple Choice)
4.8/5 (37)
On a graph with x on the horizontal axis and y on the vertical axis,the origin is
(Multiple Choice)
4.9/5 (33)
Most economics graphs reflect the relationship between how many economic variables?
(Multiple Choice)
4.8/5 (41)
If the dependent variable Y is directly related to the independent variable X,this means that changes in X cause changes in Y.
(True/False)
4.9/5 (40)
Filters
- Essay(0)
- Multiple Choice(0)
- Short Answer(0)
- True False(0)
- Matching(0)