Exam 22: understanding Graphs
Exam 1: The Art and Science of Economic Analysis162 Questions
Exam 2: Economic Tools and Economics Systems198 Questions
Exam 3: Economic Decision Makers207 Questions
Exam 4: Demand, supply, and Markets239 Questions
Exam 5: Introduction to Macroeconomics165 Questions
Exam 6: Tracking the Useconomy206 Questions
Exam 7: Unemployment and Inflation208 Questions
Exam 8: Productivity and Growth123 Questions
Exam 9: Aaggregate Expenditure and Aggregate Demand169 Questions
Exam 10: Baggregate Expenditure and Aggregate Demand144 Questions
Exam 11: Aggregate Supply211 Questions
Exam 12: Fiscal Policy169 Questions
Exam 13: Federal Budgets and Public Policy161 Questions
Exam 14: Money and the Financial System212 Questions
Exam 15: Banking and the Money Supply234 Questions
Exam 16: Monetary Theory and Policy198 Questions
Exam 17: Macro Policy Debate: Active or Passive198 Questions
Exam 18: International Trade160 Questions
Exam 19: Externalities and the Environment201 Questions
Exam 20: International Finance232 Questions
Exam 21: Economic Development97 Questions
Exam 22: understanding Graphs73 Questions
Exam 23: National Income Accounts20 Questions
Exam 24: The Algebra of Demand-Side Equilibrium72 Questions
Select questions type
If a given value of x is associated with a particular value of y,
(Multiple Choice)
4.9/5  (43)
(43)
Suppose the cost of producing copper tubing is $1 per foot.If production costs were measured on the vertical axis and quantity of copper tubing were measured on the horizontal axis,which of the following lines would have the smallest slope?
(Multiple Choice)
4.9/5 (42)
The numerical value of the slope of a line depends in part on the units of measurement used.
(True/False)
4.8/5 (36)
Exhibit 1-15 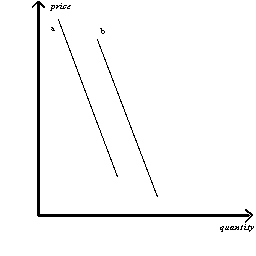 -Refer to Exhibit 1-15.The reason that Line (a)would shift to the position of Line (b)is
(Multiple Choice)
4.8/5 (33)
Exhibit 1-16 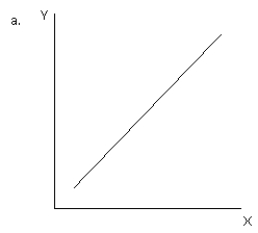
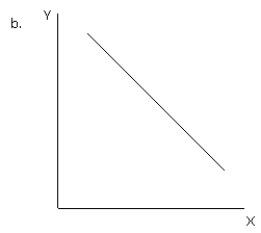
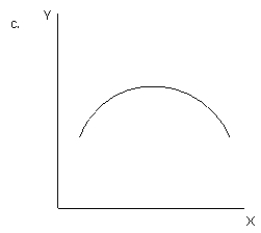
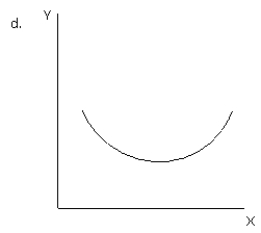
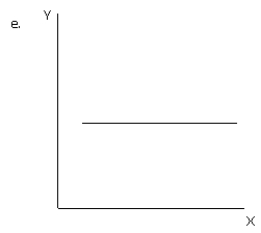 -Refer to exhibit 1-16.Which of the graphs illustrates an inverse or negative relationship between variable X and variable Y?
(Multiple Choice)
4.8/5 (43)
The slope of an inverted U-shaped curve is infinity at the top of the curve.
(True/False)
4.9/5 (38)
Any point on a graph represents a combination of particular values of two variables.
(True/False)
4.7/5 (40)
The part of a graph that is most applicable to marginal analysis is the
(Multiple Choice)
4.9/5 (33)
Filters
- Essay(0)
- Multiple Choice(0)
- Short Answer(0)
- True False(0)
- Matching(0)