Exam 22: understanding Graphs
Exam 1: The Art and Science of Economic Analysis162 Questions
Exam 2: Economic Tools and Economics Systems198 Questions
Exam 3: Economic Decision Makers207 Questions
Exam 4: Demand, supply, and Markets239 Questions
Exam 5: Introduction to Macroeconomics165 Questions
Exam 6: Tracking the Useconomy206 Questions
Exam 7: Unemployment and Inflation208 Questions
Exam 8: Productivity and Growth123 Questions
Exam 9: Aaggregate Expenditure and Aggregate Demand169 Questions
Exam 10: Baggregate Expenditure and Aggregate Demand144 Questions
Exam 11: Aggregate Supply211 Questions
Exam 12: Fiscal Policy169 Questions
Exam 13: Federal Budgets and Public Policy161 Questions
Exam 14: Money and the Financial System212 Questions
Exam 15: Banking and the Money Supply234 Questions
Exam 16: Monetary Theory and Policy198 Questions
Exam 17: Macro Policy Debate: Active or Passive198 Questions
Exam 18: International Trade160 Questions
Exam 19: Externalities and the Environment201 Questions
Exam 20: International Finance232 Questions
Exam 21: Economic Development97 Questions
Exam 22: understanding Graphs73 Questions
Exam 23: National Income Accounts20 Questions
Exam 24: The Algebra of Demand-Side Equilibrium72 Questions
Select questions type
Exhibit 1-16 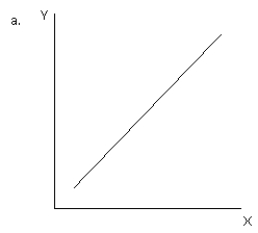
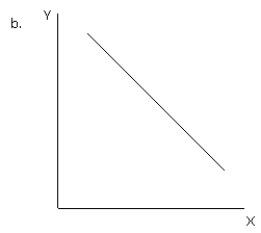
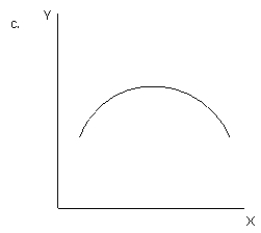
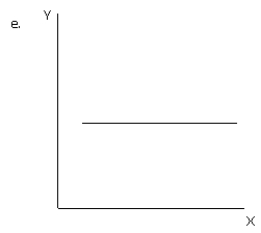 -Refer to Exhibit 1-16.Which graph illustrates a positive relationship between variable X and variable Y initially but then a negative relationship?
(Multiple Choice)
4.8/5  (33)
(33)
The slope of a steep upward-sloping line is a smaller value than the slope of a nearly flat upward-sloping line.
(True/False)
4.7/5 (39)
A curved line may have a positive slope or a negative slope,but it cannot have both positive and negative areas of slope.
(True/False)
4.9/5 (41)
If slope = -2 for a line on a graph with x on the horizontal axis and y on the vertical axis,then if
(Multiple Choice)
4.8/5 (37)
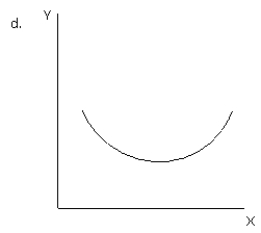
Exhibit 1-16
-Refer to Exhibit 1-16.Which graph illustrates a negative relationship between variable X and variable Y initially but then a positive relationship?
(Multiple Choice)
4.7/5 (33)
Exhibit 1-16
-Refer to exhibit 1-16.Which of the graphs illustrates a direct or positive relationship between variable X and variable Y?
(Multiple Choice)
4.8/5 (40)
Exhibit 1-7 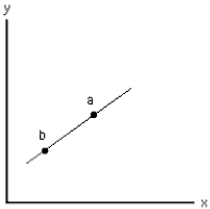 -The slope of the straight line in Exhibit 1-7 is
(Multiple Choice)
4.8/5 (36)
Ron weighs 150 pounds.A graph relating Ron's weight on the vertical axis to Nancy's consumption of ice cream on the horizontal axis would be
(Multiple Choice)
4.7/5 (48)
The slope of a U-shaped curve is infinity at the bottom of the U.
(True/False)
4.8/5 (42)
Exhibit 1-4 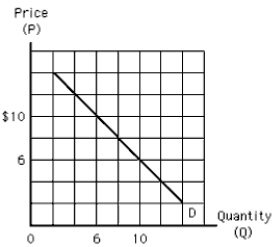 -According to the curve in Exhibit 1-4,if P increases from $10 to $14,Q
(Multiple Choice)
4.7/5 (34)
Filters
- Essay(0)
- Multiple Choice(0)
- Short Answer(0)
- True False(0)
- Matching(0)