Exam 10: Basic Macroeconomic Relationships
Exam 1: Limits, Alternatives, and Choices212 Questions
Exam 2: The Market System and the Circular Flow141 Questions
Exam 3: Demand, Supply, and Market Equilibrium202 Questions
Exam 4: Market Failures: Public Goods and Externalities155 Questions
Exam 5: Governments Role and Government Failure148 Questions
Exam 6: An Introduction to Macroeconomics123 Questions
Exam 7: Measuring Domestic Output and National Income157 Questions
Exam 8: Economic Growth114 Questions
Exam 9: Business Cycles, Unemployment, and Inflation143 Questions
Exam 10: Basic Macroeconomic Relationships142 Questions
Exam 11: The Aggregate Expenditures Model143 Questions
Exam 12: Aggregate Demand and Aggregate Supply152 Questions
Exam 13: Fiscal Policy, Deficits, and Debt164 Questions
Exam 14: Money, Banking, and Financial Institutions130 Questions
Exam 15: Money Creation127 Questions
Exam 16: Interest Rates and Monetary Policy174 Questions
Exam 17: Financial Economics136 Questions
Exam 18: Extending the Analysis of Aggregate Supply135 Questions
Exam 19: Current Issues in Macro Theory and Policy134 Questions
Exam 20: International Trade151 Questions
Exam 21: The Balance of Payments, Exchange Rates, and Trade Deficits152 Questions
Exam 22: The Economics of Developing Countries135 Questions
Select questions type
The simple multiplier formula assumes the following, except:
(Multiple Choice)
4.8/5  (33)
(33)
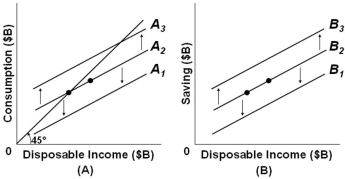 Refer to the above figures with consumption schedules in figure (A) and saving schedules in figure (B), which correspond to each other across different levels of disposable income. If, in figure (A), line A2 shifts to A3 because of the so-called wealth effect, then in figure (B) line:
(Multiple Choice)
4.8/5 (42)
The multiplier measures the change in real GDP that results from a given change in the price level.
(True/False)
4.9/5 (36)
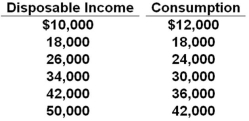 Refer to the consumption schedule above. If disposable income is $42,000, then saving is:
(Multiple Choice)
4.9/5 (41)
The table shows a consumption schedule. 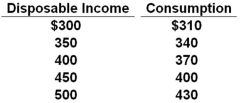 Refer to the data above. If disposable income is $550, we would expect consumption to be:
(Multiple Choice)
4.8/5 (38)
Art Buchwald's article, "Squaring the Economic Circle," is a humorous description of what happens to total income if:
(Multiple Choice)
4.7/5 (31)
Answer the following question based on the table below which illustrates the multiplier process resulting from an autonomous increase in investment by $5. 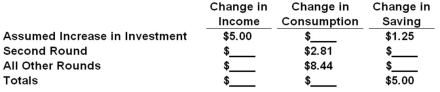 Refer to the above table. The total change in income resulting from the initial change in investment will be:
(Multiple Choice)
4.8/5 (32)
If people saved more of any extra income that they receive, then the consumption schedule will become flatter.
(True/False)
4.8/5 (40)
When a consumption schedule is plotted as a straight line, the slope of the consumption line is:
(Multiple Choice)
5.0/5 (27)
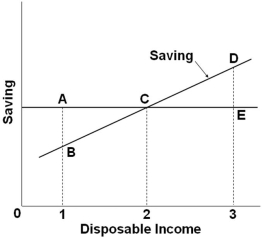 Refer to the saving schedule above. As income falls from level 3 to level 2, the amount of:
(Multiple Choice)
4.8/5 (43)
Assume there are no investment projects that will produce an expected rate of return of 8 percent or more. There are, however, $2 billion worth of investment projects with an expected rate of return at 7 percent, an additional $2 billion for every drop of the interest rate by 1 percent. If the real interest rate is 3 percent in this economy, the cumulative amount of investment at the 3 percent or higher rate of return is:
(Multiple Choice)
4.9/5 (36)
The change in real GDP resulting from an initial change in spending can be calculated by:
(Multiple Choice)
4.8/5 (35)
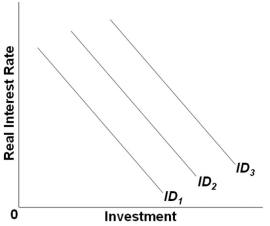 Refer to the graph above. Which of the following would shift the investment demand curve from ID2 to ID1?
(Multiple Choice)
4.9/5 (35)
The table shows a consumption schedule.  Refer to the data above. The marginal propensity to consume is:
(Multiple Choice)
4.8/5 (37)
Which of the following may shift the consumption schedule upward?
(Multiple Choice)
4.9/5 (36)
The table shows a consumption schedule.  Refer to the data above. At the $300 level of disposable income:
(Multiple Choice)
4.9/5 (29)
Assume the marginal propensity to consume is 0.8. If consumer spending increases by $20 billion, then real GDP will:
(Multiple Choice)
4.8/5 (43)
If the consumption schedule is a straight line, it can be concluded that the:
(Multiple Choice)
4.8/5 (38)
Filters
- Essay(0)
- Multiple Choice(0)
- Short Answer(0)
- True False(0)
- Matching(0)