Exam 10: Basic Macroeconomic Relationships
Exam 1: Limits, Alternatives, and Choices212 Questions
Exam 2: The Market System and the Circular Flow141 Questions
Exam 3: Demand, Supply, and Market Equilibrium202 Questions
Exam 4: Market Failures: Public Goods and Externalities155 Questions
Exam 5: Governments Role and Government Failure148 Questions
Exam 6: An Introduction to Macroeconomics123 Questions
Exam 7: Measuring Domestic Output and National Income157 Questions
Exam 8: Economic Growth114 Questions
Exam 9: Business Cycles, Unemployment, and Inflation143 Questions
Exam 10: Basic Macroeconomic Relationships142 Questions
Exam 11: The Aggregate Expenditures Model143 Questions
Exam 12: Aggregate Demand and Aggregate Supply152 Questions
Exam 13: Fiscal Policy, Deficits, and Debt164 Questions
Exam 14: Money, Banking, and Financial Institutions130 Questions
Exam 15: Money Creation127 Questions
Exam 16: Interest Rates and Monetary Policy174 Questions
Exam 17: Financial Economics136 Questions
Exam 18: Extending the Analysis of Aggregate Supply135 Questions
Exam 19: Current Issues in Macro Theory and Policy134 Questions
Exam 20: International Trade151 Questions
Exam 21: The Balance of Payments, Exchange Rates, and Trade Deficits152 Questions
Exam 22: The Economics of Developing Countries135 Questions
Select questions type
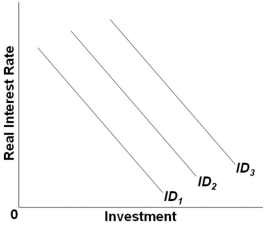 Refer to the graph above. Which of the following would shift the investment demand curve from ID2 to ID3?
Free
(Multiple Choice)
4.9/5  (39)
(39)
Correct Answer: Verified
D
The relationship between the MPS and the MPC is such that:
Free
(Multiple Choice)
4.8/5 (26)
Correct Answer:Verified
C
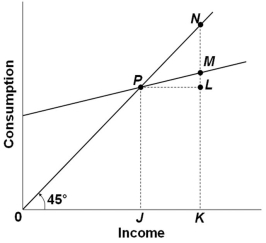 The graph above shows the relationship between consumption and income. The ratio LM/PL would be a measure of the:
Free
(Multiple Choice)
4.8/5 (41)
Correct Answer:Verified
A
If the consumption schedule shifts downward, and the shift was not caused by a tax change, then the saving schedule:
(Multiple Choice)
4.8/5 (36)
The marginal propensity to consume is the ratio of consumption to saving.
(True/False)
4.7/5 (43)
The slope of the consumption schedule between two points on the schedule is:
(Multiple Choice)
4.9/5 (32)
If consumers expect prices to rise and shortages to occur in the future, then there will be a shift:
(Multiple Choice)
4.8/5 (32)
In a private closed economy, national income is $4.5 trillion and savings equals $6.4 billion. Based on this data, the marginal propensity to consume:
(Multiple Choice)
5.0/5 (39)
A change in interest rates would shift the consumption schedule and the saving schedule ______; a change in taxes would shift these two schedules ______.
(Multiple Choice)
5.0/5 (40)
 The graph above shows the relationship between consumption and income. Which of the following statements is correct?
(Multiple Choice)
4.9/5 (29)
The investment demand curve is drawn with the amount of investment on the:
(Multiple Choice)
4.9/5 (44)
The value of the multiplier is likely to fall if there is a fall in:
(Multiple Choice)
4.7/5 (42)
The disposable income (DI) and consumption (C) schedules are for a private, closed economy. All figures are in billions of dollars. 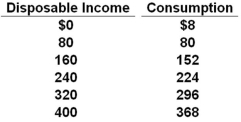 Refer to the data above. The marginal propensity to save in this economy is:
(Multiple Choice)
4.9/5 (35)
If disposable income is $900 billion when the average propensity to consume is 0.9, it can be concluded that:
(Multiple Choice)
4.9/5 (46)
If disposable income is $350 billion and the average propensity to consume is .80, then personal saving is $70 billion.
(True/False)
4.8/5 (28)
When the marginal propensity to consume is less than 1, the:
(Multiple Choice)
4.8/5 (35)
 Refer to the graph above. Which of the following would shift the investment demand curve from ID2 to ID1?
(Multiple Choice)
4.8/5 (34)
Filters
- Essay(0)
- Multiple Choice(0)
- Short Answer(0)
- True False(0)
- Matching(0)