Exam 10: Basic Macroeconomic Relationships
Exam 1: Limits, Alternatives, and Choices212 Questions
Exam 2: The Market System and the Circular Flow141 Questions
Exam 3: Demand, Supply, and Market Equilibrium202 Questions
Exam 4: Market Failures: Public Goods and Externalities155 Questions
Exam 5: Governments Role and Government Failure148 Questions
Exam 6: An Introduction to Macroeconomics123 Questions
Exam 7: Measuring Domestic Output and National Income157 Questions
Exam 8: Economic Growth114 Questions
Exam 9: Business Cycles, Unemployment, and Inflation143 Questions
Exam 10: Basic Macroeconomic Relationships142 Questions
Exam 11: The Aggregate Expenditures Model143 Questions
Exam 12: Aggregate Demand and Aggregate Supply152 Questions
Exam 13: Fiscal Policy, Deficits, and Debt164 Questions
Exam 14: Money, Banking, and Financial Institutions130 Questions
Exam 15: Money Creation127 Questions
Exam 16: Interest Rates and Monetary Policy174 Questions
Exam 17: Financial Economics136 Questions
Exam 18: Extending the Analysis of Aggregate Supply135 Questions
Exam 19: Current Issues in Macro Theory and Policy134 Questions
Exam 20: International Trade151 Questions
Exam 21: The Balance of Payments, Exchange Rates, and Trade Deficits152 Questions
Exam 22: The Economics of Developing Countries135 Questions
Select questions type
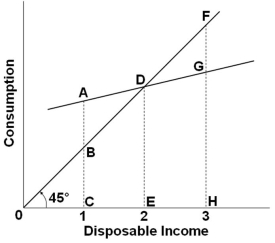 Refer to the consumption schedule above. At income level 3, the amount of saving is represented by the line segment:
(Multiple Choice)
4.9/5  (39)
(39)
Answer the following question based on the table below which illustrates the multiplier process resulting from an autonomous increase in investment by $5. 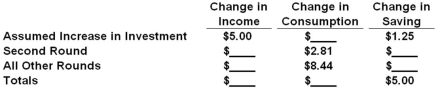 Refer to the above table. The change in income in round two will be:
(Multiple Choice)
4.7/5 (34)
An increase in business taxes will tend to shift the investment-demand curve rightward.
(True/False)
4.9/5 (42)
During the Great Recession of 2007-2009, real interest rates:
(Multiple Choice)
4.9/5 (44)
An increase in taxes will shift both the consumption schedule and the saving schedule down.
(True/False)
4.9/5 (39)
If there is a decrease in disposable income in an economy, then:
(Multiple Choice)
4.7/5 (40)
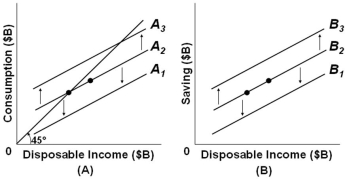 Refer to the above figures with consumption schedules in figure (A) and saving schedules in figure (B), which correspond to each other across different levels of disposable income. If, in figure (A), consumption increases along line A2 then in figure (B) there would be:
(Multiple Choice)
4.9/5 (44)
If disposable income decreases from $1800 to $1500 and MPC = 0.75, then saving will:
(Multiple Choice)
4.8/5 (34)
The wealth effect will tend to decrease consumption and increase saving.
(True/False)
4.9/5 (41)
Assume that an increase in a household's disposable income from $40,000 to $48,000 leads to an increase in consumption from $35,000 to $41,000, then the:
(Multiple Choice)
4.9/5 (32)
The disposable income (DI) and consumption (C) schedules are for a private, closed economy. All figures are in billions of dollars. 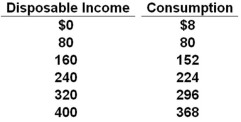 Refer to the data above. If plotted on a graph, the slope of the consumption schedule would be:
(Multiple Choice)
4.8/5 (43)
As the consumption and saving schedules relate to real GDP, an increase in taxes will shift:
(Multiple Choice)
4.8/5 (30)
In an economy, for every $10 million increase in disposable income, saving increases by $2 million. It can be concluded that the:
(Multiple Choice)
4.8/5 (42)
If the slope of a linear consumption schedule increases in a private closed economy, then it can be concluded that the:
(Multiple Choice)
4.9/5 (36)
If consumption increases while income remains the same, the average propensity to consume will:
(Multiple Choice)
4.9/5 (38)
A business firm will purchase additional capital goods if the real rate of interest in the economy is less than the expected rate of return from the investment.
(True/False)
4.9/5 (32)
An MPC value of less than 1.0 indicates that as income increases:
(Multiple Choice)
4.9/5 (39)
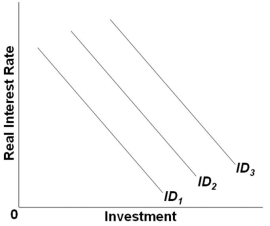 Refer to the graph above. Which of the following would shift the investment demand curve from ID2 to ID3?
(Multiple Choice)
4.8/5 (35)
During the Great Recession of 2007-2009, the investment demand curve shifted:
(Multiple Choice)
4.9/5 (39)
Filters
- Essay(0)
- Multiple Choice(0)
- Short Answer(0)
- True False(0)
- Matching(0)