Exam 13: Analyzing and Interpreting Financial Statements
Exam 1: Introducing Financial Accounting270 Questions
Exam 2: Accounting System and Financial Statements236 Questions
Exam 3: Adjusting Accounts for Financial Statements271 Questions
Exam 4: Reporting and Analyzing Merchandising Operations263 Questions
Exam 5: Reporting and Analyzing Inventories218 Questions
Exam 6: Reporting and Analyzing Cash and Internal Controls215 Questions
Exam 7: Reporting and Analyzing Receivables207 Questions
Exam 8: Reporting and Analyzing Long-Term Assets255 Questions
Exam 9: Reporting and Analyzing Current Liabilities224 Questions
Exam 10: Reporting and Analyzing Long-Term Liabilities231 Questions
Exam 11: Reporting and Analyzing Equity248 Questions
Exam 12: Reporting and Analyzing Cash Flows226 Questions
Exam 13: Analyzing and Interpreting Financial Statements223 Questions
Exam 14: Applying Present and Future Values76 Questions
Exam 15: Investments and International Operations215 Questions
Exam 16: Reporting and Analyzing Partnerships168 Questions
Select questions type
Financial analysis only refers to the communication of relevant financial information to decision makers.
(True/False)
4.7/5  (32)
(32)
Capital structure refers to a company's long-run financial viability and its ability to cover long-term obligations.
(True/False)
4.8/5 (32)
A corporation reported cash of $14,000 and total assets of $178,300. Its common-size percent for cash equals 7.85%.
($14,000/$178,300) * 100 = 7.85%
(True/False)
4.9/5 (49)
____________ is a method of analysis used to evaluate individual financial statement items or groups of items in terms of a specific base amount.
(Short Answer)
4.9/5 (33)
A ratio expresses a mathematical relation between two quantities and can be expressed as a percent, rate, or proportion.
(True/False)
4.8/5 (47)
Calculate the percent increases for each of the following balance sheet items. 
(Essay)
4.9/5 (37)
Liquidity refers to the availability of resources to meet short-term cash requirements.
(True/False)
4.8/5 (41)
Ratios must refer to economically important relationships, such as a sale price compared to its cost.
(True/False)
4.7/5 (43)
General-purpose financial statements include the (1) income statement, (2) balance sheet, (3) statement of stockholders' equity (or statement of retained earnings), (4) statement of cash flows, and (5) notes to these statements.
(True/False)
4.8/5 (41)
The comparison of a company's financial condition and performance across time is known as:
(Multiple Choice)
4.9/5 (32)
Comparative calendar year financial data for a company are shown below. Calculate the following ratios for 2017:
(a) return on total assets
(b) return on common stockholders' equity. 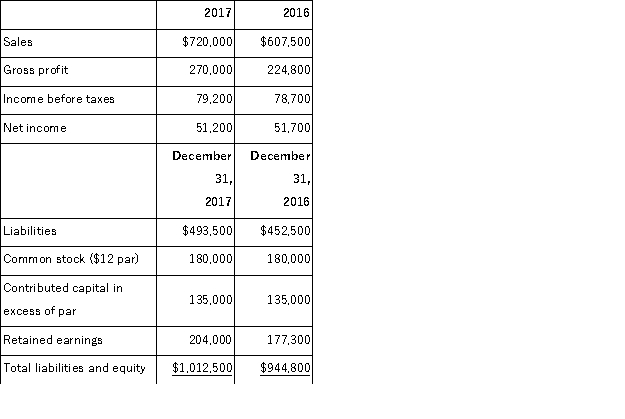
(Essay)
4.9/5 (34)
The higher the accounts receivable turnover, the less quickly accounts receivable are collected.
(True/False)
4.9/5 (39)
Refer to the following selected financial information from Keller Company. Compute the company's debt to equity for Year 2. 
(Multiple Choice)
4.8/5 (33)
Earnings per share are calculated only on income from continuing operations.
(True/False)
4.9/5 (32)
Trend analysis is a form of horizontal analysis that can reveal patterns in data across successive periods.
(True/False)
4.8/5 (37)
Carducci Corporation reported Net Sales of $3.6 million and beginning Total Assets of $0.9 million and ending Total Assets of 1.3 million. The average total asset amount is:
(Multiple Choice)
4.9/5 (30)
Washburn Company reported sales of $1,722,000 for Year 1 and $1,831,000 for Year 2. Using Year 1 as the base year, what was the percentage change for sales from Year 1 to Year 2?
(Multiple Choice)
4.8/5 (36)
Filters
- Essay(0)
- Multiple Choice(0)
- Short Answer(0)
- True False(0)
- Matching(0)