Exam 13: Analyzing and Interpreting Financial Statements
Exam 1: Introducing Financial Accounting270 Questions
Exam 2: Accounting System and Financial Statements236 Questions
Exam 3: Adjusting Accounts for Financial Statements271 Questions
Exam 4: Reporting and Analyzing Merchandising Operations263 Questions
Exam 5: Reporting and Analyzing Inventories218 Questions
Exam 6: Reporting and Analyzing Cash and Internal Controls215 Questions
Exam 7: Reporting and Analyzing Receivables207 Questions
Exam 8: Reporting and Analyzing Long-Term Assets255 Questions
Exam 9: Reporting and Analyzing Current Liabilities224 Questions
Exam 10: Reporting and Analyzing Long-Term Liabilities231 Questions
Exam 11: Reporting and Analyzing Equity248 Questions
Exam 12: Reporting and Analyzing Cash Flows226 Questions
Exam 13: Analyzing and Interpreting Financial Statements223 Questions
Exam 14: Applying Present and Future Values76 Questions
Exam 15: Investments and International Operations215 Questions
Exam 16: Reporting and Analyzing Partnerships168 Questions
Select questions type
The market price of Horokhiv Corporation's common stock at the end of the fiscal year 2016 was $47.50 and it declared and paid cash dividends of $3.28 per share. The dividend yield ratio for 2016 is:
(Multiple Choice)
4.8/5  (41)
(41)
_________________ applies analytical tools to general-purpose financial statements and related data for making business decisions.
(Short Answer)
4.8/5 (43)
Refer to the following selected financial information from McCormik, LLC. Compute the company's acid-test ratio for Year 2. 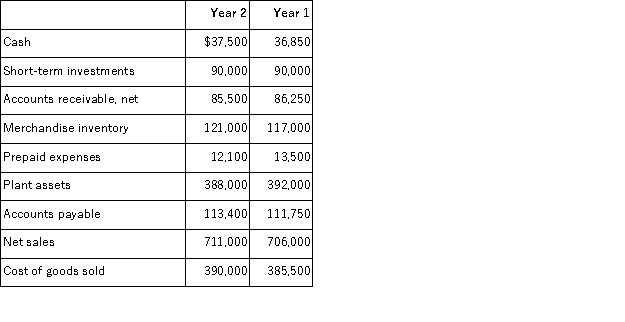
(Multiple Choice)
4.9/5 (43)
Profitability is the ability to generate future revenues and meet long-term obligations.
(True/False)
4.8/5 (35)
Use the following selected information from Wheeler, LLC to determine the 2017 and 2016 common size percentages for cost of goods sold using Net sales as the base. 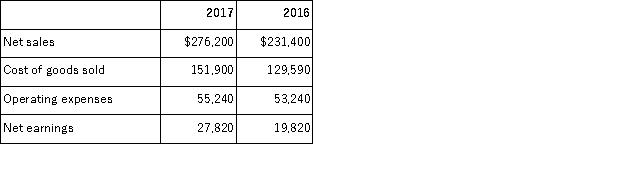
(Multiple Choice)
4.8/5 (44)
Horizontal analysis is the comparison of a company's financial condition and performance to a base amount.
(True/False)
4.8/5 (35)
Refer to the following selected financial information from McCormik, LLC. Compute the company's days' sales in inventory for Year 2. 
(Multiple Choice)
4.9/5 (38)
Zhang Company reported Cost of goods sold of $835,000, beginning Inventory of $38,560 and ending Inventory of $41,750. The Days' sales in inventory (rounded to whole days) is:
(Multiple Choice)
4.8/5 (30)
Three of the most common tools of financial analysis include horizontal analysis, vertical analysis, and ratio analysis.
(True/False)
5.0/5 (43)
A company with a high inventory turnover requires a smaller investment in inventory than one producing the same sales with a lower turnover.
(True/False)
4.8/5 (32)
Zhang Company reported Cost of goods sold of $835,000 and average Inventory of $41,750. The Inventory turnover ratio is:
(Multiple Choice)
4.8/5 (40)
The comparative income statements for Silverlight Company are shown below. Calculate the following ratios for 2017:
(a) profit margin
(b) gross margin
(c) times interest earned. 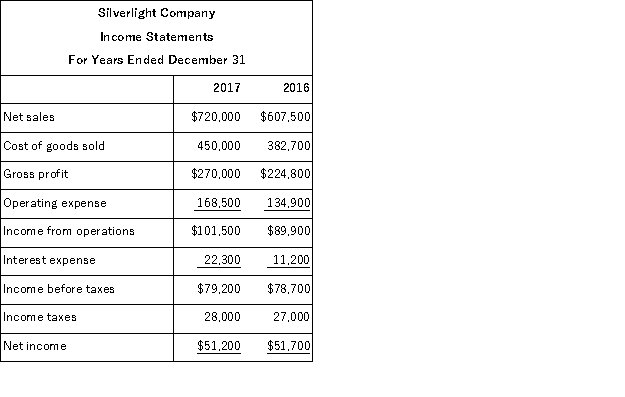
(Essay)
4.9/5 (43)
Identify and explain the four building blocks of financial statement analysis.
(Essay)
4.8/5 (36)
Financial information for Sigma Company is presented below. Calculate the following ratios for 2017:
(a) Inventory turnover.
(b) Accounts receivable turnover.
(c) Return on total assets.
(d) Times interest earned.
(e) Total asset turnover. 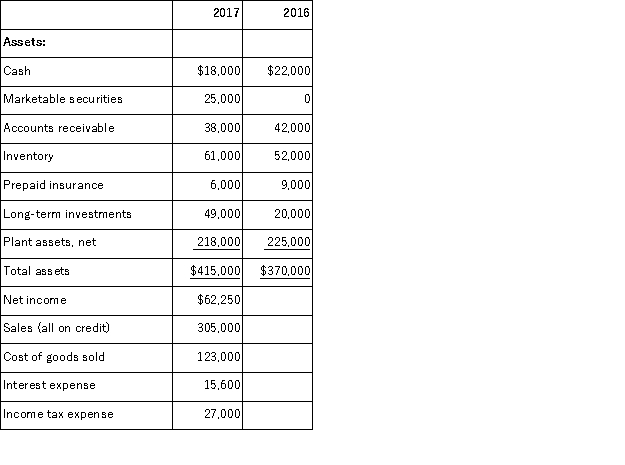
(Essay)
4.9/5 (41)
Horizontal analysis is used to reveal patterns in data covering successive periods.
(True/False)
5.0/5 (31)
Refer to the following selected financial information from McCormik, LLC. Compute the company's working capital for Year 2. 
(Multiple Choice)
4.9/5 (38)
A good financial statement analysis report often includes the following sections: executive summary, analysis overview, evidential matter, assumptions, key factors, and inferences.
(True/False)
4.9/5 (38)
Analysis of a single financial number is often of limited value.
(True/False)
4.9/5 (36)
Rajan Company's most recent balance sheet reported total assets of $1.9 million, total liabilities of $0.8 million, and total equity of $1.1 million. Its debt to equity ratio is:
(Multiple Choice)
4.8/5 (38)
Standards for comparisons in financial statement analysis do not include:
(Multiple Choice)
4.7/5 (42)
Filters
- Essay(0)
- Multiple Choice(0)
- Short Answer(0)
- True False(0)
- Matching(0)