Exam 13: Analyzing and Interpreting Financial Statements
Exam 1: Introducing Financial Accounting270 Questions
Exam 2: Accounting System and Financial Statements236 Questions
Exam 3: Adjusting Accounts for Financial Statements271 Questions
Exam 4: Reporting and Analyzing Merchandising Operations263 Questions
Exam 5: Reporting and Analyzing Inventories218 Questions
Exam 6: Reporting and Analyzing Cash and Internal Controls215 Questions
Exam 7: Reporting and Analyzing Receivables207 Questions
Exam 8: Reporting and Analyzing Long-Term Assets255 Questions
Exam 9: Reporting and Analyzing Current Liabilities224 Questions
Exam 10: Reporting and Analyzing Long-Term Liabilities231 Questions
Exam 11: Reporting and Analyzing Equity248 Questions
Exam 12: Reporting and Analyzing Cash Flows226 Questions
Exam 13: Analyzing and Interpreting Financial Statements223 Questions
Exam 14: Applying Present and Future Values76 Questions
Exam 15: Investments and International Operations215 Questions
Exam 16: Reporting and Analyzing Partnerships168 Questions
Select questions type
Use the following selected information from Wheeler, LLC to determine the 2017 and 2016 trend percentages for net sales using 2016 as the base. 
(Multiple Choice)
4.8/5  (41)
(41)
Yeats Corporation's sales in Year 1 were $396,000 and in Year 2 were $380,000. Using Year 1 as the base year, the percent change for Year 2 compared to the base year is:
(Multiple Choice)
4.9/5 (39)
Selected current year end financial information for a company is presented below. Calculate the following company ratios:
(a) Profit margin.
(b) Total asset turnover.
(c) Return on total assets.
(d) Return on common stockholders' equity (assume the company has no preferred stock). 
(Essay)
4.7/5 (35)
Refer to the following selected financial information from Shakley's Incorporated. Compute the company's return on total assets for Year 2. 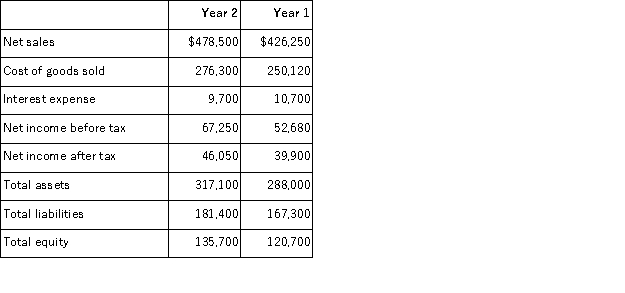
(Multiple Choice)
4.7/5 (38)
Express the following balance sheets for Safety Company in common-size percentages. 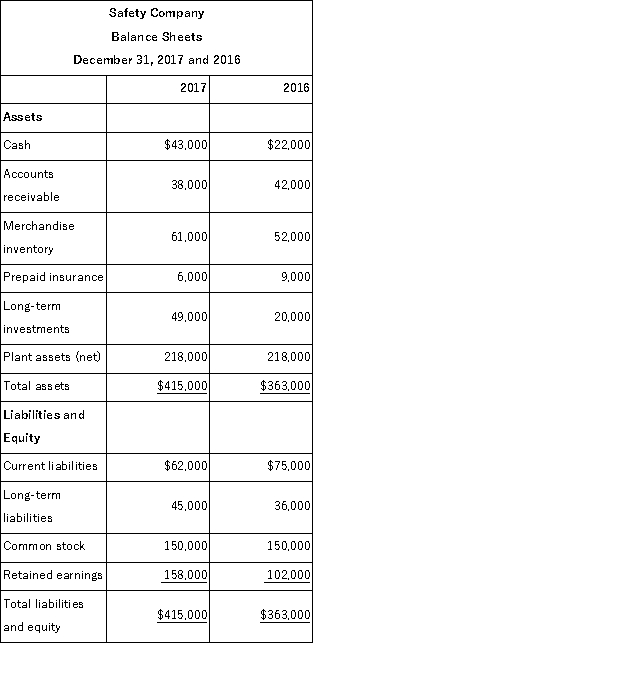
(Essay)
4.7/5 (41)
A good financial report does not link interpretations and conclusions of analysis with the underlying information.
(True/False)
4.8/5 (30)
Refer to the following selected financial information from Shakley's Incorporated. Compute the company's times interest earned for Year 2. 
(Multiple Choice)
4.9/5 (35)
The ability to generate future revenues and meet long-term obligations is referred to as:
(Multiple Choice)
4.7/5 (41)
The greater the times interest earned ratio, the greater the risk a company is exposed to.
(True/False)
4.8/5 (31)
Explain the purpose of financial statement analysis for both external and internal users.
(Essay)
4.9/5 (34)
Refer to the following selected financial information from Graceworks Corp. Compute the company's inventory turnover for Year 2. 
(Multiple Choice)
4.8/5 (37)
Refer to the following selected financial information from Graceworks, Corp. Compute the company's days' sales in inventory for Year 2. 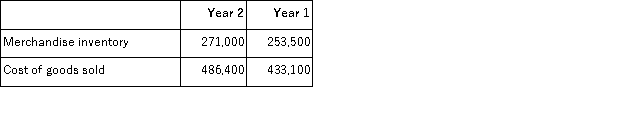
(Multiple Choice)
4.8/5 (37)
Graphical analysis of the balance sheet can be useful in assessing sources of financing.
(True/False)
4.9/5 (40)
Refer to the following selected financial information from Marston Company. Compute the company's accounts receivable turnover for Year 2. 
(Multiple Choice)
4.9/5 (35)
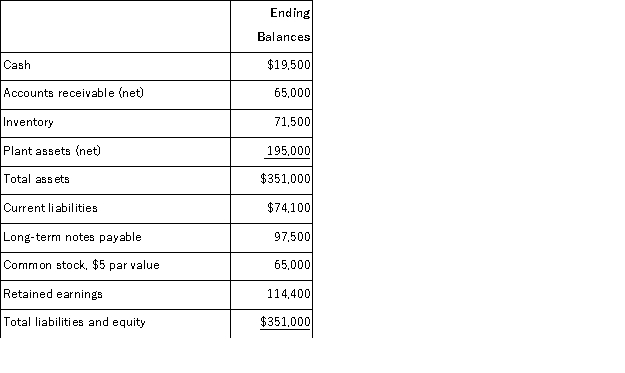
A company's calendar-year financial data are shown below. The company had total assets of $339,000 and total equity of $144,400 for the prior year. No additional shares of common stock were issued during the year. The December 31 market price per share is $49.50. Cash dividends of $19,500 were paid during the year. Calculate the following ratios for the company:
(a) debt ratio
(b) equity ratio
(c) debt-to-equity ratio
(d) times interest earned
(e) total asset turnover 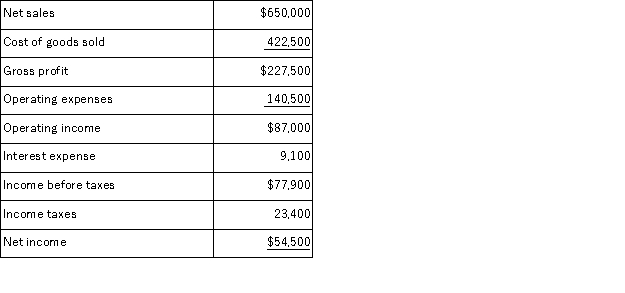
(Essay)
4.8/5 (41)
Selected current year company information follows:  The return on total assets is:
(Multiple Choice)
4.9/5 (34)
Financial statement analysis lessens the need for expert judgment.
(True/False)
4.8/5 (44)
A financial statement analysis report helps to reduce uncertainty in business decisions through a rigorous and sound evaluation.
(True/False)
4.8/5 (39)
Filters
- Essay(0)
- Multiple Choice(0)
- Short Answer(0)
- True False(0)
- Matching(0)