Exam 16: How Well Am I Doing Financial Statement Analysis
Exam 1: Managerial Accounting and the Business Environment25 Questions
Exam 2: Managerial Accounting and Cost Concepts148 Questions
Exam 3: Systems Design: Job-Order Costing163 Questions
Exam 4: Systems Design: Process Costing106 Questions
Exam 5: Cost Behavior Analysis and Use119 Questions
Exam 6: Cost-Volume-Profit Relationship213 Questions
Exam 7: Variable Costing: a Tool for Management136 Questions
Exam 8: Activity Based Costing: a Tool to Aid Decision-Making77 Questions
Exam 9: Profit Planning144 Questions
Exam 10: Flexible Budgets and Performance Analysis294 Questions
Exam 11: Standard Costs and Operating Performance Measures163 Questions
Exam 12: Segment Reporting, Decentralization, and the Balanced Scorecard99 Questions
Exam 13: Relevant Costs for Decision Making131 Questions
Exam 14: Capital Budgeting Decisions138 Questions
Exam 15: How Well Am I Doing Statement of Cash Flows103 Questions
Exam 16: How Well Am I Doing Financial Statement Analysis207 Questions
Exam 17: Pricing Products and Services61 Questions
Exam 18: Profitability Analysis72 Questions
Exam 19: Further Classification of Labor Costs18 Questions
Exam 20: Cost of Quality24 Questions
Exam 21: the Predetermined Overhead Rate and Capacity25 Questions
Exam 22: Fifo Method72 Questions
Exam 23: Service Department Allocations51 Questions
Exam 24: Least-Squares Regression Computations14 Questions
Exam 25: Abc Action Analysis14 Questions
Exam 26: Using a Modified Form of Activity-Based Costing to17 Questions
Exam 27: Predetermined Overhead Rates and Overhead Analysis88 Questions
Exam 28: Journal Entries to Record Variances46 Questions
Exam 29: Transfer Pricing20 Questions
Exam 30: Service Department Charges34 Questions
Exam 31: The Concept of Present Value14 Questions
Exam 32: Income Taxes in Capital Budgeting Decisions33 Questions
Exam 33: The Direct Method of Determining the Net Cash Provided by42 Questions
Select questions type
Selected financial data (in thousands of dollars) for Barnstable Company appear below: 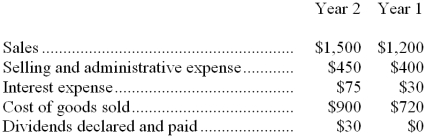 -For Year 2, the gross margin as a percentage of sales was:
(Multiple Choice)
4.8/5  (41)
(41)
Kapinos Corporation has provided the following data: 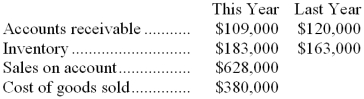 Required:
Compute the accounts receivable turnover for this year. Show your work!
Required:
Compute the accounts receivable turnover for this year. Show your work!
(Essay)
4.9/5 (28)
Excerpts from Stys Corporation's most recent balance sheet and income statement appear below: 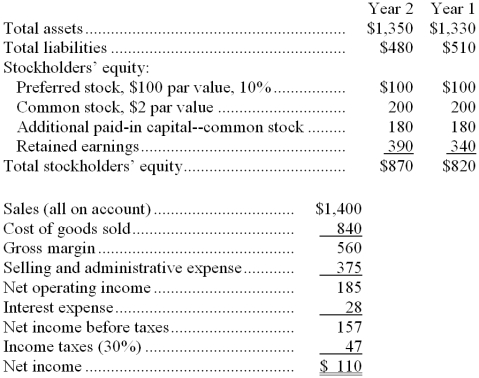 Dividends on common stock during Year 2 totaled $50 thousand. Dividends on preferred stock totaled $10 thousand. The market price of common stock at the end of Year 2 was $8.20 per share.
-The price-earnings ratio for Year 2 is closest to:
Dividends on common stock during Year 2 totaled $50 thousand. Dividends on preferred stock totaled $10 thousand. The market price of common stock at the end of Year 2 was $8.20 per share.
-The price-earnings ratio for Year 2 is closest to:
(Multiple Choice)
4.8/5 (36)
Draper Company's working capital is $12,000 and its current liabilities are $71,000. The company's current ratio is closest to:
(Multiple Choice)
4.8/5 (33)
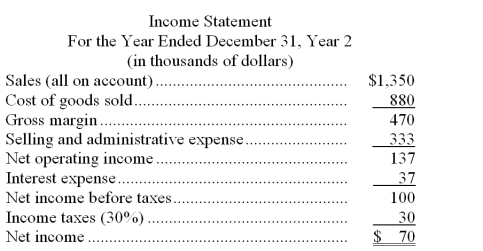
Mccaughey Corporation's most recent balance sheet and income statement appear below:
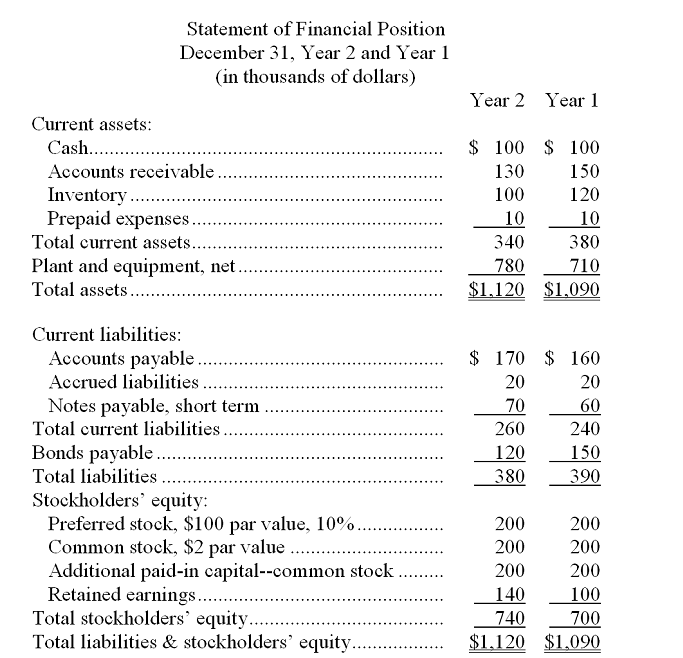
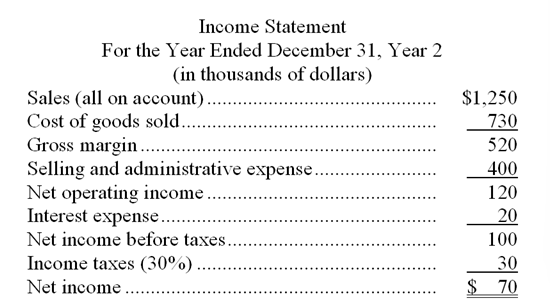 -The acid-test ratio at the end of Year 2 is closest to:
(Multiple Choice)
4.8/5 (42)
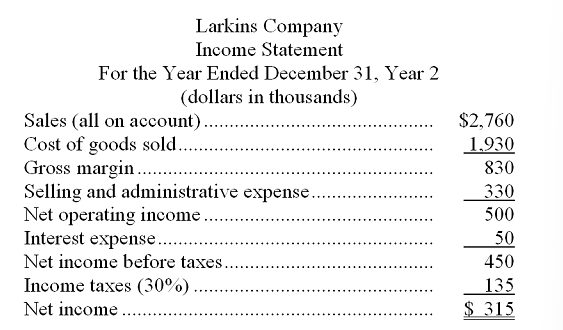
Financial statements for Larkins Company appear below:
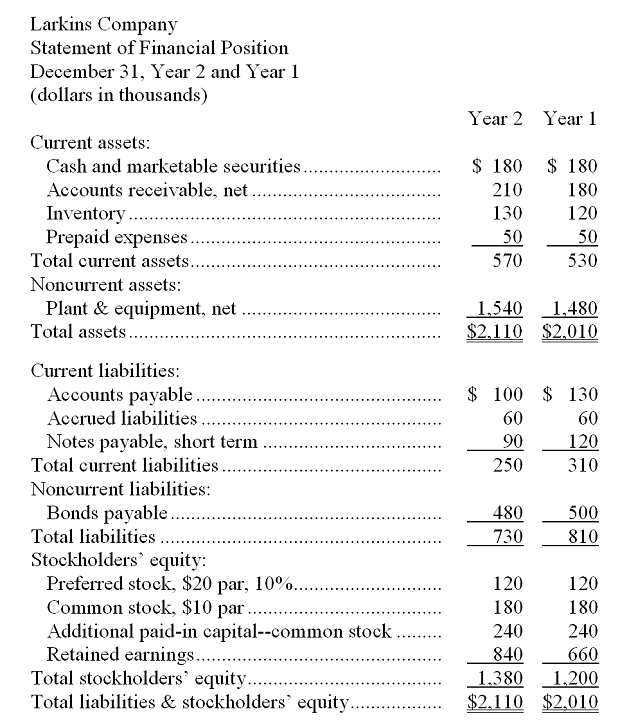
 Dividends during Year 2 totaled $135 thousand, of which $12 thousand were preferred dividends. The market price of a share of common stock on December 31, Year 2 was $150.
-Larkins Company's dividend yield ratio on December 31, Year 2 was closest to:
Dividends during Year 2 totaled $135 thousand, of which $12 thousand were preferred dividends. The market price of a share of common stock on December 31, Year 2 was $150.
-Larkins Company's dividend yield ratio on December 31, Year 2 was closest to:
(Multiple Choice)
4.9/5 (39)
Excerpts from Stys Corporation's most recent balance sheet and income statement appear below: Dividends on common stock during Year 2 totaled $50 thousand. Dividends on preferred stock totaled $10 thousand. The market price of common stock at the end of Year 2 was $8.20 per share.
-The return on common stockholders' equity for Year 2 is closest to:
(Multiple Choice)
4.8/5 (31)
Mccaughey Corporation's most recent balance sheet and income statement appear below:
-What will happen to the ratios below if CPZ Enterprises uses cash to pay 50 percent of its accounts payable? 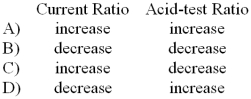
(Multiple Choice)
4.8/5 (34)
Excerpts from Stys Corporation's most recent balance sheet and income statement appear below: Dividends on common stock during Year 2 totaled $50 thousand. Dividends on preferred stock totaled $10 thousand. The market price of common stock at the end of Year 2 was $8.20 per share.
-The earnings per share of common stock for Year 2 is closest to:
(Multiple Choice)
4.9/5 (35)
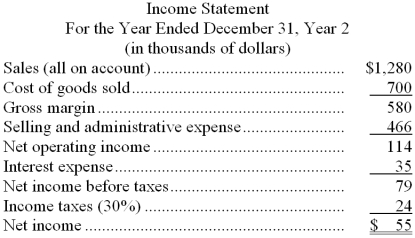
Financial statements for Nardella Company appear below: 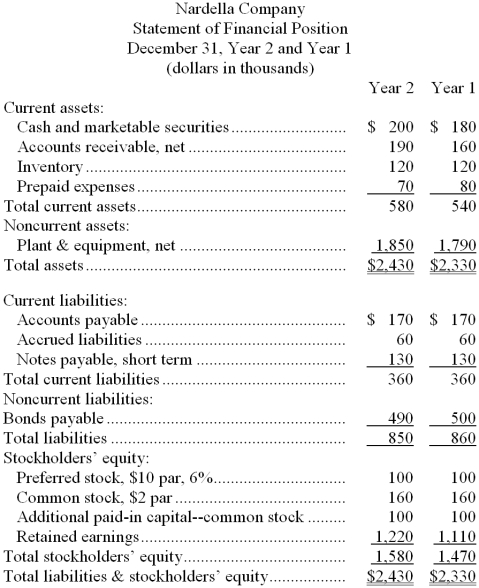
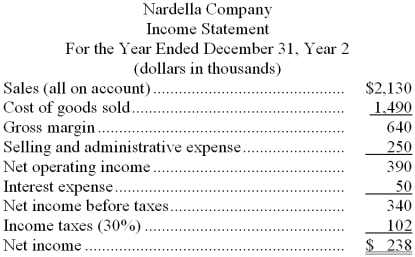 -Nardella Company's times interest earned for Year 2 was closest to:
(Multiple Choice)
4.9/5 (31)
Dadisman Corporation's most recent balance sheet and income statement appear below: 
 Dividends on common stock during Year 2 totaled $30 thousand. Dividends on preferred stock totaled $20 thousand. The market price of common stock at the end of Year 2 was $6.75 per share.
-The earnings per share of common stock for Year 2 is closest to:
Dividends on common stock during Year 2 totaled $30 thousand. Dividends on preferred stock totaled $20 thousand. The market price of common stock at the end of Year 2 was $6.75 per share.
-The earnings per share of common stock for Year 2 is closest to:
(Multiple Choice)
4.7/5 (42)
Lesmerises Corporation's most recent balance sheet and income statement appear below: 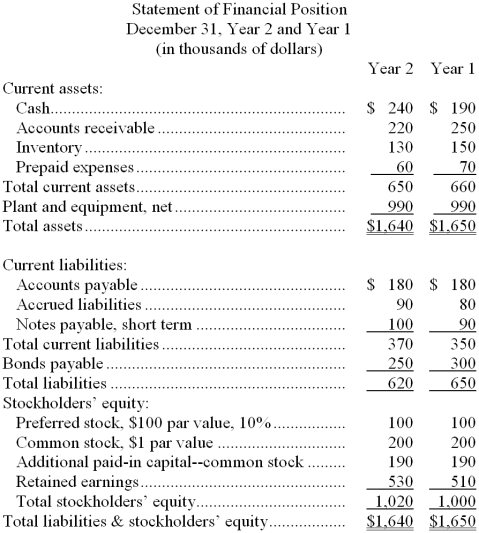
 Dividends on common stock during Year 2 totaled $40 thousand. Dividends on preferred stock totaled $10 thousand. The market price of common stock at the end of Year 2 was $2.85 per share.
-The times interest earned for Year 2 is closest to:
Dividends on common stock during Year 2 totaled $40 thousand. Dividends on preferred stock totaled $10 thousand. The market price of common stock at the end of Year 2 was $2.85 per share.
-The times interest earned for Year 2 is closest to:
(Multiple Choice)
4.9/5 (32)
Guynn Corporation's most recent balance sheet and income statement appear below: 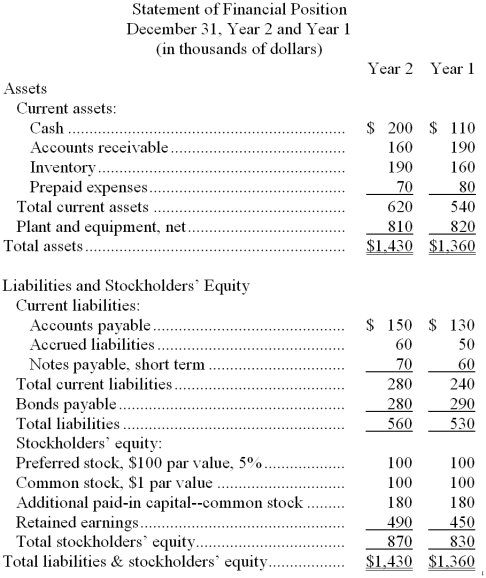
 Dividends on common stock during Year 2 totaled $10 thousand. Dividends on preferred stock totaled $5 thousand. The market price of common stock at the end of Year 2 was $7.05 per share.
-The gross margin percentage for Year 2 is closest to:
Dividends on common stock during Year 2 totaled $10 thousand. Dividends on preferred stock totaled $5 thousand. The market price of common stock at the end of Year 2 was $7.05 per share.
-The gross margin percentage for Year 2 is closest to:
(Multiple Choice)
4.8/5 (33)
Lesmerises Corporation's most recent balance sheet and income statement appear below: Dividends on common stock during Year 2 totaled $40 thousand. Dividends on preferred stock totaled $10 thousand. The market price of common stock at the end of Year 2 was $2.85 per share.
-The inventory turnover for Year 2 is closest to:
(Multiple Choice)
4.7/5 (44)
Financial statements for Larkins Company appear below:
Dividends during Year 2 totaled $135 thousand, of which $12 thousand were preferred dividends. The market price of a share of common stock on December 31, Year 2 was $150.
-Lisa Inc.'s book value per share of common stock at December 31, Year 2, was closest to:
(Multiple Choice)
4.8/5 (33)
Mccaughey Corporation's most recent balance sheet and income statement appear below:
-The working capital at the end of Year 2 is:
(Multiple Choice)
4.8/5 (31)
Bracken Company's net income last year was $85,000 and its interest expense was $10,000. Total assets at the beginning of the year were $660,000 and total assets at the end of the year were $600,000. The company's income tax rate was 30%. The company's return on total assets for the year was closest to:
(Multiple Choice)
4.8/5 (33)
Spina Corporation's net income last year was $5,472,000. The dividend on common stock was $10.70 per share and the dividend on preferred stock was $3.00 per share. The market price of common stock at the end of the year was $49.20 per share. Throughout the year, 400,000 shares of common stock and 100,000 shares of preferred stock were outstanding.
Required:
Compute the dividend payout ratio. Show your work!
(Essay)
4.8/5 (32)
Guynn Corporation's most recent balance sheet and income statement appear below: Dividends on common stock during Year 2 totaled $10 thousand. Dividends on preferred stock totaled $5 thousand. The market price of common stock at the end of Year 2 was $7.05 per share.
-The book value per share at the end of Year 2 is closest to:
(Multiple Choice)
4.9/5 (36)
The inventory turnover ratio is equal to the average inventory balance divided by the cost of goods sold.
(True/False)
4.9/5 (32)
Filters
- Essay(0)
- Multiple Choice(0)
- Short Answer(0)
- True False(0)
- Matching(0)