Exam 16: How Well Am I Doing Financial Statement Analysis
Exam 1: Managerial Accounting and the Business Environment25 Questions
Exam 2: Managerial Accounting and Cost Concepts148 Questions
Exam 3: Systems Design: Job-Order Costing163 Questions
Exam 4: Systems Design: Process Costing106 Questions
Exam 5: Cost Behavior Analysis and Use119 Questions
Exam 6: Cost-Volume-Profit Relationship213 Questions
Exam 7: Variable Costing: a Tool for Management136 Questions
Exam 8: Activity Based Costing: a Tool to Aid Decision-Making77 Questions
Exam 9: Profit Planning144 Questions
Exam 10: Flexible Budgets and Performance Analysis294 Questions
Exam 11: Standard Costs and Operating Performance Measures163 Questions
Exam 12: Segment Reporting, Decentralization, and the Balanced Scorecard99 Questions
Exam 13: Relevant Costs for Decision Making131 Questions
Exam 14: Capital Budgeting Decisions138 Questions
Exam 15: How Well Am I Doing Statement of Cash Flows103 Questions
Exam 16: How Well Am I Doing Financial Statement Analysis207 Questions
Exam 17: Pricing Products and Services61 Questions
Exam 18: Profitability Analysis72 Questions
Exam 19: Further Classification of Labor Costs18 Questions
Exam 20: Cost of Quality24 Questions
Exam 21: the Predetermined Overhead Rate and Capacity25 Questions
Exam 22: Fifo Method72 Questions
Exam 23: Service Department Allocations51 Questions
Exam 24: Least-Squares Regression Computations14 Questions
Exam 25: Abc Action Analysis14 Questions
Exam 26: Using a Modified Form of Activity-Based Costing to17 Questions
Exam 27: Predetermined Overhead Rates and Overhead Analysis88 Questions
Exam 28: Journal Entries to Record Variances46 Questions
Exam 29: Transfer Pricing20 Questions
Exam 30: Service Department Charges34 Questions
Exam 31: The Concept of Present Value14 Questions
Exam 32: Income Taxes in Capital Budgeting Decisions33 Questions
Exam 33: The Direct Method of Determining the Net Cash Provided by42 Questions
Select questions type
Excerpts from Shelton Corporation's most recent balance sheet appear below: 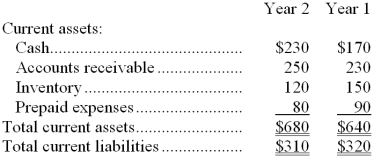 Sales on account in Year 2 amounted to $1,320 and the cost of goods sold was $890.
-The average sale period for Year 2 is closest to:
Sales on account in Year 2 amounted to $1,320 and the cost of goods sold was $890.
-The average sale period for Year 2 is closest to:
(Multiple Choice)
4.8/5  (38)
(38)
If a company's bonds bear an interest rate of 8%, the tax rate is 30%, and the company's assets are generating an after-tax return of 7%, then the leverage would be:
(Multiple Choice)
4.9/5 (38)
Last year Jack Company had a net income of $270,000, income tax expense of $50,000, and interest expense of $20,000. The company's times interest earned was closest to:
(Multiple Choice)
4.8/5 (36)
Cintron Corporation's total current assets are $370,000, its noncurrent assets are $740,000, its total current liabilities are $300,000, its long-term liabilities are $430,000, and its stockholders' equity is $380,000. The current ratio is closest to:
(Multiple Choice)
4.8/5 (38)
The acid-test ratio is a test of the quality of accounts receivable--in other words, whether they are likely to be collected.
(True/False)
4.9/5 (30)
The gross margin percentage is computed taking the difference between sales and cost of goods and then dividing the result by sales.
(True/False)
4.8/5 (46)
Financial statements for Oram Company appear below: 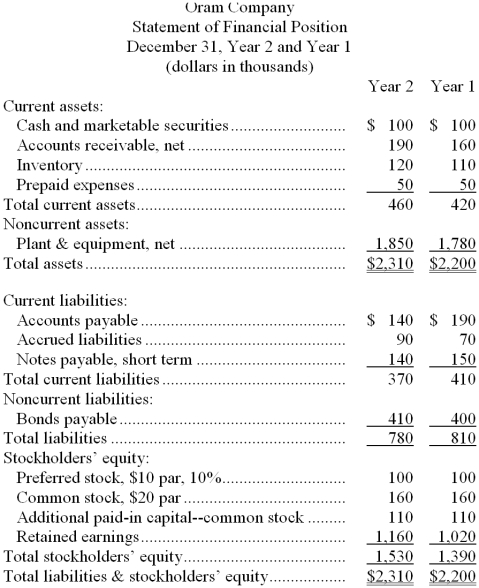
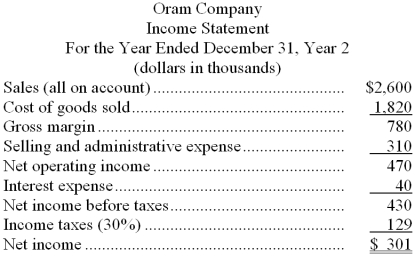 Dividends during Year 2 totaled $161 thousand, of which $10 thousand were preferred dividends. The market price of a share of common stock on December 31, Year 2 was $610.
-Oram Company's earnings per share of common stock for Year 2 was closest to:
Dividends during Year 2 totaled $161 thousand, of which $10 thousand were preferred dividends. The market price of a share of common stock on December 31, Year 2 was $610.
-Oram Company's earnings per share of common stock for Year 2 was closest to:
(Multiple Choice)
4.9/5 (35)
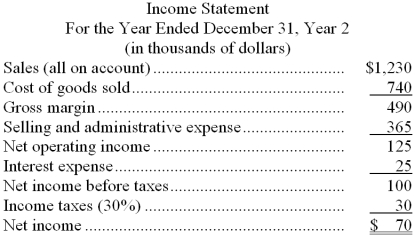
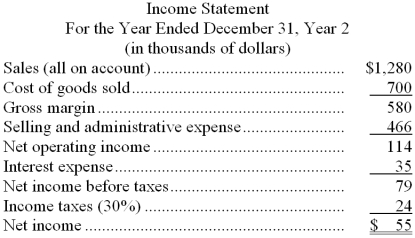
Financial statements for Praven Company appear below: 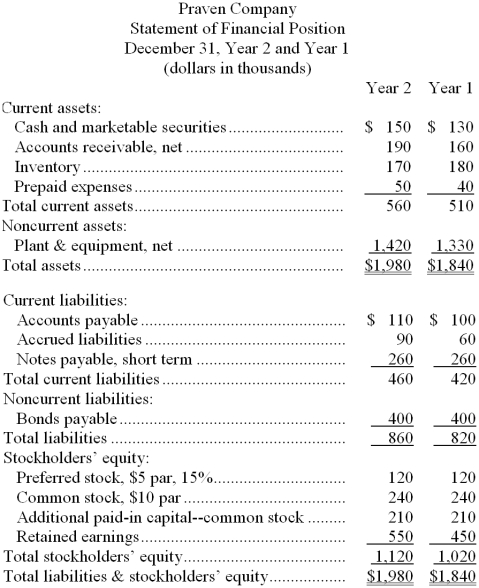
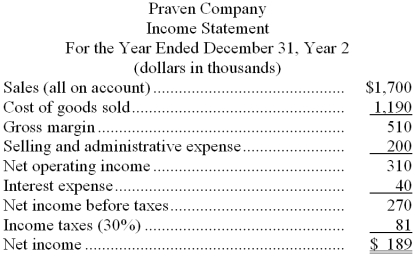 Dividends during Year 2 totaled $89 thousand, of which $18 thousand were preferred dividends. The market price of a share of common stock on December 31, Year 2 was $130.
Required:
Compute the following for Year 2:
a. Earnings per share of common stock.
b. Price-earnings ratio.
c. Dividend payout ratio.
d. Dividend yield ratio.
e. Return on total assets.
f. Return on common stockholders' equity.
g. Book value per share.
h. Working capital.
i. Current ratio.
j. Acid-test ratio.
k. Accounts receivable turnover.
l. Average collection period.
m. Inventory turnover.
n. Average sale period.
o. Times interest earned.
p. Debt-to-equity ratio.
Dividends during Year 2 totaled $89 thousand, of which $18 thousand were preferred dividends. The market price of a share of common stock on December 31, Year 2 was $130.
Required:
Compute the following for Year 2:
a. Earnings per share of common stock.
b. Price-earnings ratio.
c. Dividend payout ratio.
d. Dividend yield ratio.
e. Return on total assets.
f. Return on common stockholders' equity.
g. Book value per share.
h. Working capital.
i. Current ratio.
j. Acid-test ratio.
k. Accounts receivable turnover.
l. Average collection period.
m. Inventory turnover.
n. Average sale period.
o. Times interest earned.
p. Debt-to-equity ratio.
(Essay)
4.7/5 (36)
Lesmerises Corporation's most recent balance sheet and income statement appear below: 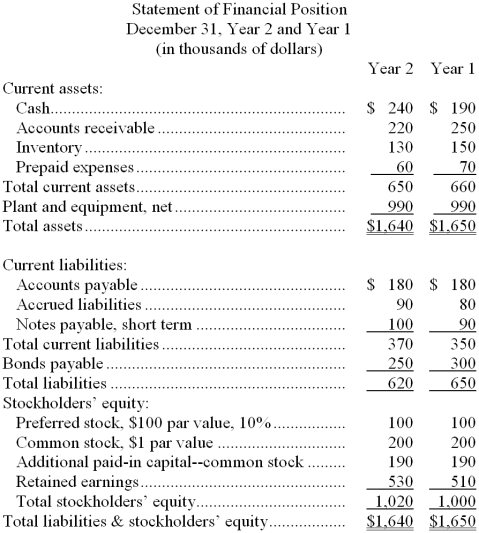
 Dividends on common stock during Year 2 totaled $40 thousand. Dividends on preferred stock totaled $10 thousand. The market price of common stock at the end of Year 2 was $2.85 per share.
-The accounts receivable turnover for Year 2 is closest to:
Dividends on common stock during Year 2 totaled $40 thousand. Dividends on preferred stock totaled $10 thousand. The market price of common stock at the end of Year 2 was $2.85 per share.
-The accounts receivable turnover for Year 2 is closest to:
(Multiple Choice)
4.8/5 (34)
Arston Company's net income last year was $300,000. The company has 150,000 shares of common stock and 60,000 shares of preferred stock outstanding. There was no change in the number of common or preferred shares outstanding during the year. The company declared and paid dividends last year of $1.50 per share on the common stock and $0.60 per share on the preferred stock. The earnings per share of common stock is closest to:
(Multiple Choice)
5.0/5 (35)
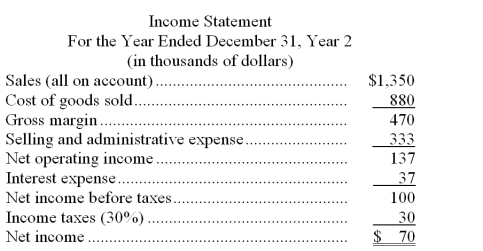
Financial statements for Larkins Company appear below:
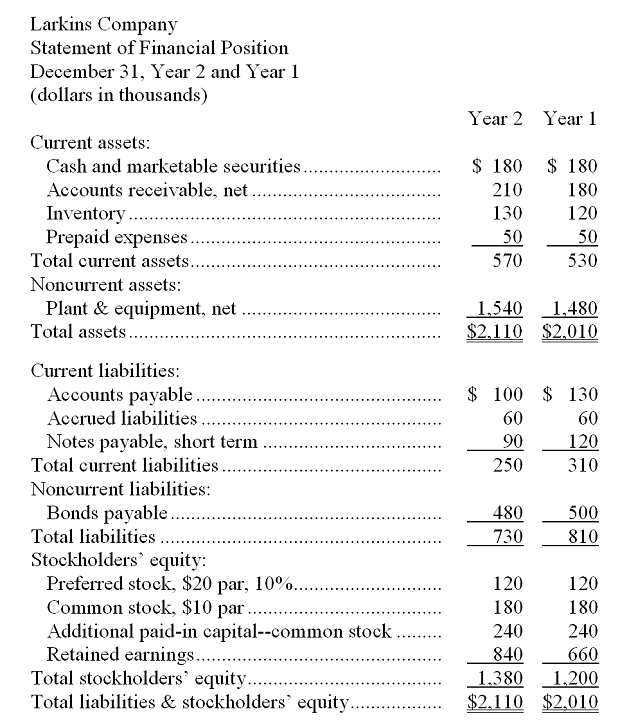
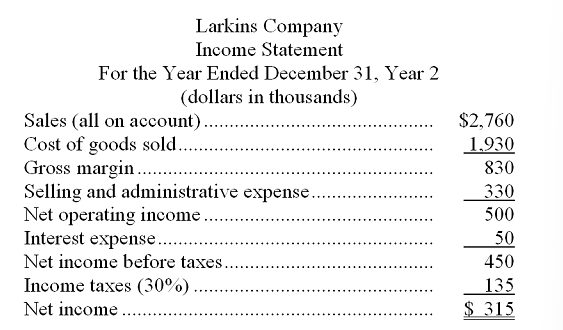 Dividends during Year 2 totaled $135 thousand, of which $12 thousand were preferred dividends. The market price of a share of common stock on December 31, Year 2 was $150.
-Lisa Inc.'s acid-test ratio at December 31, Year 2, was closest to:
Dividends during Year 2 totaled $135 thousand, of which $12 thousand were preferred dividends. The market price of a share of common stock on December 31, Year 2 was $150.
-Lisa Inc.'s acid-test ratio at December 31, Year 2, was closest to:
(Multiple Choice)
4.9/5 (35)
Which of the following is true regarding the calculation of return on total assets?
(Multiple Choice)
4.9/5 (34)
Excerpts from Deandrade Corporation's most recent balance sheet appear below: 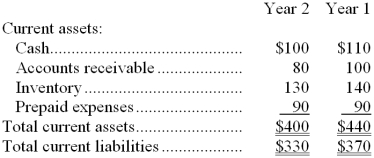 Sales on account in Year 2 amounted to $1,360 and the cost of goods sold was $830.
-The inventory turnover for Year 2 is closest to:
Sales on account in Year 2 amounted to $1,360 and the cost of goods sold was $830.
-The inventory turnover for Year 2 is closest to:
(Multiple Choice)
4.8/5 (47)
Dadisman Corporation's most recent balance sheet and income statement appear below: 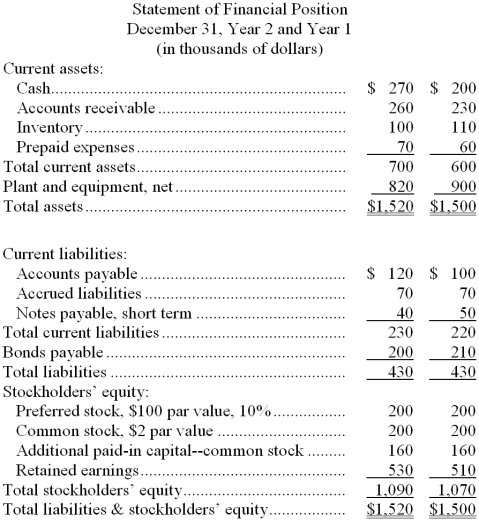
 Dividends on common stock during Year 2 totaled $30 thousand. Dividends on preferred stock totaled $20 thousand. The market price of common stock at the end of Year 2 was $6.75 per share.
-The book value per share at the end of Year 2 is closest to:
Dividends on common stock during Year 2 totaled $30 thousand. Dividends on preferred stock totaled $20 thousand. The market price of common stock at the end of Year 2 was $6.75 per share.
-The book value per share at the end of Year 2 is closest to:
(Multiple Choice)
4.8/5 (41)
Data from Karmely Corporation's most recent balance sheet and the company's income statement appear below: 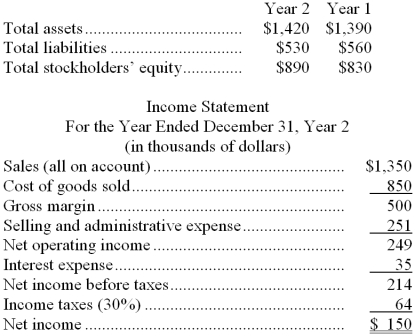 -The times interest earned for Year 2 is closest to:
(Multiple Choice)
4.8/5 (33)
Horizontal analysis of financial statements is accomplished through:
(Multiple Choice)
4.7/5 (32)
Mccaughey Corporation's most recent balance sheet and income statement appear below:
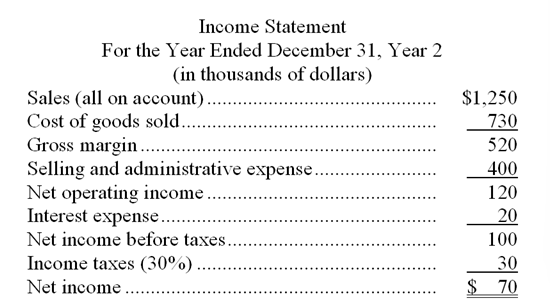 -The accounts receivable turnover for Year 2 is closest to:
(Multiple Choice)
4.7/5 (33)
Financial statements for Oram Company appear below: Dividends during Year 2 totaled $161 thousand, of which $10 thousand were preferred dividends. The market price of a share of common stock on December 31, Year 2 was $610.
-Oram Company's accounts receivable turnover for Year 2 was closest to:
(Multiple Choice)
4.9/5 (34)
Data from Alf Corporation's most recent balance sheet and income statement appear below: 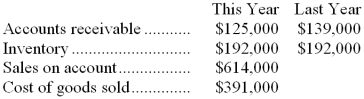 The average collection period for this year is closest to:
(Multiple Choice)
4.7/5 (37)
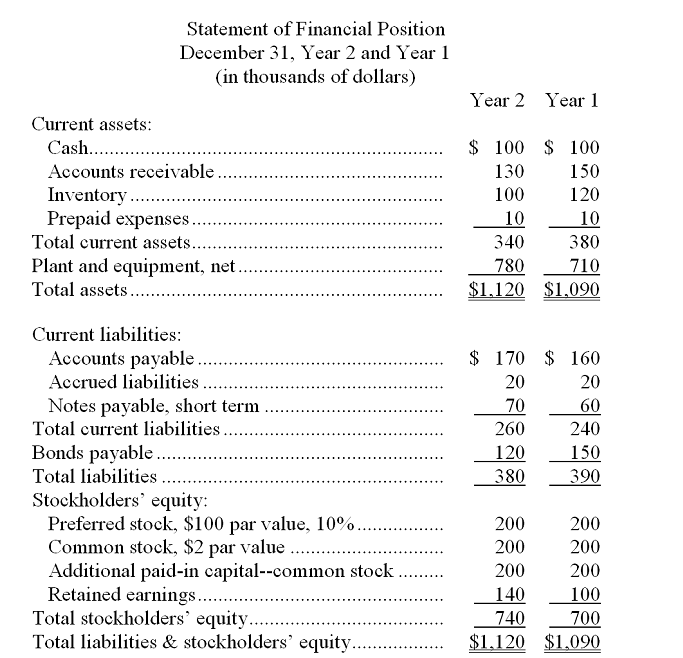
Guynn Corporation's most recent balance sheet and income statement appear below: 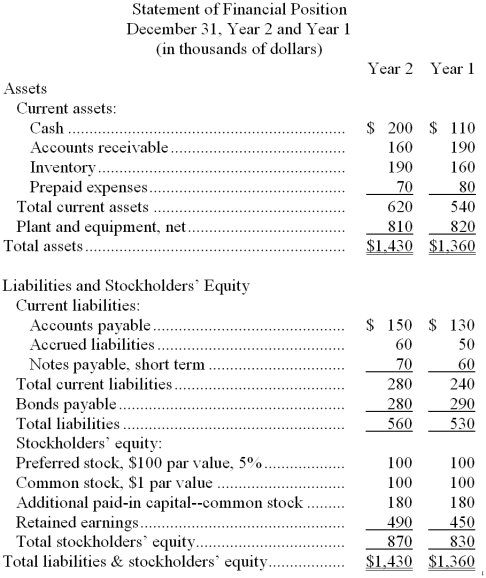
 Dividends on common stock during Year 2 totaled $10 thousand. Dividends on preferred stock totaled $5 thousand. The market price of common stock at the end of Year 2 was $7.05 per share.
-The earnings per share of common stock for Year 2 is closest to:
Dividends on common stock during Year 2 totaled $10 thousand. Dividends on preferred stock totaled $5 thousand. The market price of common stock at the end of Year 2 was $7.05 per share.
-The earnings per share of common stock for Year 2 is closest to:
(Multiple Choice)
4.8/5 (30)
Filters
- Essay(0)
- Multiple Choice(0)
- Short Answer(0)
- True False(0)
- Matching(0)