Exam 6: Exploring Data: Relationships
Exam 1: Urban Services107 Questions
Exam 2: Business Efficiency104 Questions
Exam 3: Planning and Scheduling108 Questions
Exam 4: Linear Programming111 Questions
Exam 5: Exploring Data: Distributions115 Questions
Exam 6: Exploring Data: Relationships104 Questions
Exam 7: Data for Decisions99 Questions
Exam 8: Probability: the Mathematics of Chance108 Questions
Exam 9: Social Choice: the Impossible Dream103 Questions
Exam 10: The Manipulability of Voting Systems106 Questions
Exam 11: Weighted Voting Systems111 Questions
Exam 12: Electing the President93 Questions
Exam 13: Fair Division121 Questions
Exam 14: Apportionment112 Questions
Exam 15: Game Theory: the Mathematics of Competition113 Questions
Exam 16: Identification Numbers110 Questions
Exam 17: Information Science94 Questions
Exam 18: Growth and Form111 Questions
Exam 19: Symmetry and Patterns115 Questions
Exam 20: Tilings112 Questions
Exam 21: Savings Models113 Questions
Exam 22: Borrowing Models113 Questions
Exam 23: The Economics of Resources119 Questions
Select questions type
Use the following Table to answer the Questions: Hours spent partying per week (x) 10 40 0 5 60 20 12 GPA (y) 3.4 0.5 3.9 3.7 4.0 1.3 3.1
-What is the slope of the regression line?
(Essay)
4.9/5  (41)
(41)
Use the following scatterplot to answer the Questions: 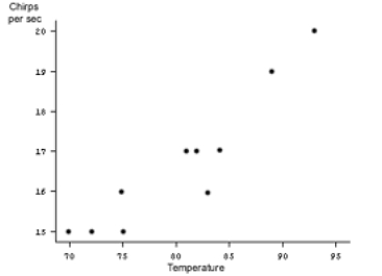 -What conclusions can you reach if you hear 18 chirps a minute?
(Multiple Choice)
4.8/5 (41)
A data set has = 5, = 10, Sx = 2, Sy = 3 . What is the standardized value of =7?
(Multiple Choice)
4.9/5 (32)
If the least-squares regression line is y = 3x − 5, the value y = 1 is predicted for what value of x?
(Multiple Choice)
4.8/5 (38)
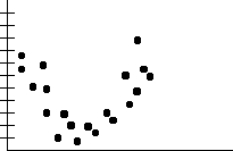
Suppose a scatterplot shows four clusters at each corner of the plot. What can you say about the feasibility of using a least-squares regression line to describe these data?
(Essay)
4.8/5 (38)
A university admissions counselor wishes to predict the performance of freshmen by considering their SAT scores. Which variable, freshman GPA or SAT score, would be the explanatory variable in a least squares regression equation?
(Multiple Choice)
4.9/5 (37)
Use the following scatterplot to answer the Questions:
-What can you say about the slope of the least-squares regression line?
(Multiple Choice)
4.9/5 (40)
Is it possible for the correlation for a scatterplot to change dramatically when a single point is moved?
(Essay)
4.8/5 (39)
If the units of measurement change to larger units, then the correlation:
(Multiple Choice)
4.9/5 (41)
Below is the scatterplot for data collected on two variables. Would a least-squares regression equation be useful in describing the relationship between the variables? Why or why not? 
(Essay)
4.8/5 (43)
Use the table below to answer the following Questions . Temperature in degrees F(y) 70 72 74 75 81 82 83 84 89 93 Chirps per second (x) 15 15 15 16 17 17 16 17 19 20
-What is the correlation between the variables?
(Multiple Choice)
4.7/5 (37)
Use the table below to answer the following Questions . Temperature in degrees F(y) 70 72 74 75 81 82 83 84 89 93 Chirps per second (x) 15 15 15 16 17 17 16 17 19 20
-Let x = number of chirps per second and y = temperature. How many points are above the regression line?
(Multiple Choice)
4.7/5 (23)
Max is collecting baseball cards. He has 65 cards that his aunt gave him for his birthday, and he buys 20 more each week. The total number y of cards that Max has after x weeks is given by which of the following equations?
(Multiple Choice)
4.7/5 (35)
A data set has = 2, = 7, Sx = 3, Sy = 3 r = 0.95 Which of the following point is on the least-squares regression line?
(Multiple Choice)
4.9/5 (41)
Use the following scatterplot to answer the Questions:
 -What can you say about the correlation of the data?
(Multiple Choice)
5.0/5 (42)
Use the following data to answer the Questions: 66 118 50 99 73 120 69 121 72 123 65 108 62 111
-What type of association exists between the variables on the scatterplot?
(Short Answer)
4.9/5 (35)
A typing service keeps data on the number of pages (x) in a manuscript and the length of time (y) (in hours) it takes to complete the typing. The least-squares regression line for the data is given by y = 20 + 0.273x. Use this to predict the amount of hours needed to type a 40-page manuscript.
(Multiple Choice)
5.0/5 (27)
If two variables named x and y have a strong positive association, then:
(Multiple Choice)
4.8/5 (33)
If the x and y coordinates of a scatterplot are exchanged, the intercept of the regression line:
(Multiple Choice)
4.8/5 (39)
Filters
- Essay(0)
- Multiple Choice(0)
- Short Answer(0)
- True False(0)
- Matching(0)