Exam 6: Exploring Data: Relationships
Exam 1: Urban Services107 Questions
Exam 2: Business Efficiency104 Questions
Exam 3: Planning and Scheduling108 Questions
Exam 4: Linear Programming111 Questions
Exam 5: Exploring Data: Distributions115 Questions
Exam 6: Exploring Data: Relationships104 Questions
Exam 7: Data for Decisions99 Questions
Exam 8: Probability: the Mathematics of Chance108 Questions
Exam 9: Social Choice: the Impossible Dream103 Questions
Exam 10: The Manipulability of Voting Systems106 Questions
Exam 11: Weighted Voting Systems111 Questions
Exam 12: Electing the President93 Questions
Exam 13: Fair Division121 Questions
Exam 14: Apportionment112 Questions
Exam 15: Game Theory: the Mathematics of Competition113 Questions
Exam 16: Identification Numbers110 Questions
Exam 17: Information Science94 Questions
Exam 18: Growth and Form111 Questions
Exam 19: Symmetry and Patterns115 Questions
Exam 20: Tilings112 Questions
Exam 21: Savings Models113 Questions
Exam 22: Borrowing Models113 Questions
Exam 23: The Economics of Resources119 Questions
Select questions type
Use the following data to answer the Questions: .
Let x = time spent studying and y = test score. Time spent 1 2 5 4 6 7 8 5 2 4 3 5 studying(hours) Test score 49 57 80 70 88 91 98 80 57 72 65 82 (percentage) -Choice
-What is the slope of the regression line?
(Multiple Choice)
4.8/5  (28)
(28)
Use the following scatterplot to answer the Questions:
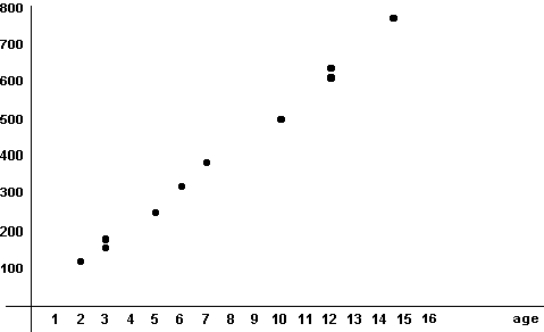 -For the scatterplot shown above, what can you say about the correlation?
(Multiple Choice)
4.7/5 (24)
What can you say about the slope of a regression line for variables that are negatively associated?
(Short Answer)
4.8/5 (28)
If the x and y coordinates of a scatterplot are exchanged, variables that were previously positively associated:
(Multiple Choice)
5.0/5 (37)
If all the points of a scatterplot lie on a straight line, what can you say about the correlation of the data?
(Short Answer)
4.8/5 (43)
Use the following Table to answer the Questions: Hours spent partying per week (x) 10 40 0 5 60 20 12 GPA (y) 3.4 0.5 3.9 3.7 4.0 1.3 3.1
-What is the correlation for these data?
(Essay)
4.9/5 (33)
To choose advertising media, a marketing analyst studies the relationship between a consumer's income and the amount spent on restaurant dining. Which variable, consumer's income or dining expenditures, would be the response variable for a least-squares regression equation?
(Multiple Choice)
4.9/5 (38)
The least-squares regression equation y = 50 + 0.1x gives the yield in bushels per acre of corn when x pounds of fertilizer are applied. Predict the yield for a farmer who plans to use 320 pounds of fertilizer.
(Multiple Choice)
4.9/5 (31)
If the x and y coordinates of a scatterplot are exchanged, the slope of the regression line:
(Multiple Choice)
4.8/5 (42)
Suppose the equation for a regression line is y = 18 − 3x. If x = 4, what is the predicted corresponding value for y?
(Short Answer)
4.8/5 (28)
To determine the effectiveness of group study sessions, a college instructor gathers data on hours of attendance and exam scores for students in the class. Which variable, hours of attendance or exam scores, would be the response variable for a least-squares regression equation?
(Multiple Choice)
4.8/5 (40)
If the x and y coordinates of a scatterplot are exchanged, the correlation of the variables:
(Multiple Choice)
4.8/5 (32)
For professional baseball players, one would expect a negative correlation between:
(Multiple Choice)
4.8/5 (39)
Use the following data set to answer the Questions: Length of commute in miles (x) 2 10 8 30 12 70 15 20 Time of commute in minutes (y) 5 25 20 45 25 80 30 35
-What is the slope of the regression line?
(Multiple Choice)
4.8/5 (30)
Use the following data set to answer the Questions: Length of commute in miles (x) 2 10 8 30 12 70 15 20 Time of commute in minutes (y) 5 25 20 45 25 80 30 35
-What is the actual length of a 0-mile commute?
(Multiple Choice)
4.9/5 (27)
If the correlation between two variables is −1, then the points of their scatterplot:
(Multiple Choice)
4.7/5 (44)
Use the following scatterplot to answer the Questions: 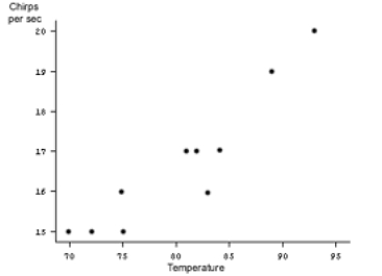 -What can you say about the correlation?
(Multiple Choice)
4.7/5 (39)
Suppose that ages and hours of time slept per day are gathered from people at a mall. According to these data, young children and older adults tend to sleep more than older children and younger adults. How could you describe the resulting scatterplot of this data, where x represents ages and y represents the amount of sleep per day?
(Essay)
4.8/5 (31)
If the points of a scatterplot lie on a straight line, then the correlation:
(Multiple Choice)
4.8/5 (35)
Consider the data set below. x 1 2 3 y 7 6 5 Adding the data point (3, 6) to this data set:
(Multiple Choice)
4.9/5 (34)
Filters
- Essay(0)
- Multiple Choice(0)
- Short Answer(0)
- True False(0)
- Matching(0)