Exam 15: Nonparametric Methods: Goodness-Of-Fit Tests
Exam 1: What Is Statistics79 Questions
Exam 2: Describing Data: Frequency Tables, Frequency Distributions, and Graphic Presentation129 Questions
Exam 3: Describing Data: Numerical Measures117 Questions
Exam 4: Describing Data: Displaying and Exploring Data92 Questions
Exam 5: A Survey of Probability Concepts121 Questions
Exam 6: Discrete Probability Distributions114 Questions
Exam 7: Continuous Probability Distributions100 Questions
Exam 8: Sampling Methods and the Central Limit Theorem114 Questions
Exam 9: Estimation and Confidence Intervals114 Questions
Exam 10: One-Sample Tests of Hypothesis129 Questions
Exam 11: Two-Sample Tests of Hypothesis122 Questions
Exam 12: Analysis of Variance92 Questions
Exam 13: Correlation and Linear Regression130 Questions
Exam 14: Multiple Regression Analysis122 Questions
Exam 15: Nonparametric Methods: Goodness-Of-Fit Tests128 Questions
Select questions type
Six people have declared their intentions to run for a seat on the school board in the next local election. A poll is conducted during the campaign among 1,020 randomly sampled voters to determine if there is any clear preference among the voters. The responses are shown next. 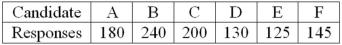 What is the critical value at the 1% level of significance?
Free
(Short Answer)
4.8/5  (43)
(43)
Correct Answer: Verified
15.086
Recently, students in a marketing research class were interested in the driving behavior of students. Specifically, the marketing students were interested in finding out if exceeding the speed limit was related to social activity. They collected the following responses from 100 randomly selected students: 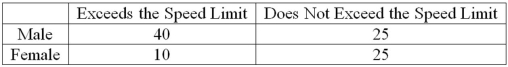 What is the value of the test statistic?
Free
(Multiple Choice)
5.0/5 (41)
Correct Answer:Verified
B
A frequency distribution has a mean of 200 and a standard deviation of 20. The class limits for one class are 220 up to 240. Based on the normal distribution, what is the probability that an observation would be in this class?
Free
(Multiple Choice)
4.8/5 (33)
Correct Answer:Verified
A
What is our decision for a goodness-of-fit test with a computed chi-square value of 1.273 and a critical value of 13.388?
(Multiple Choice)
4.9/5 (31)
A question has these possible responses-excellent, very good, good, fair, and unsatisfactory. What are the degrees of freedom for a goodness-of-fit test to test the hypothesis that responses are uniformly distributed?
(Multiple Choice)
4.8/5 (26)
We are interested in knowing if the following frequency distribution is normally distributed. The population mean and standard deviation of the data are 600 and 160, respectively. 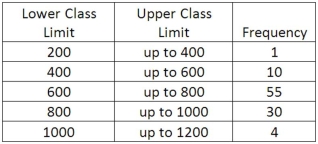 If the distribution was normally distributed, what is the probability that an observation would be a member of the "800 up to 1000" class?
(Short Answer)
4.8/5 (34)
We are interested in knowing if the following frequency distribution is normally distributed. The population mean and standard deviation of the data are 600 and 160, respectively. 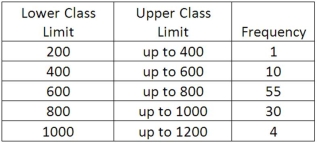 If the distribution was normally distributed, what is the probability that an observation would be a member of the "800 up to 1000" class?
(Short Answer)
4.8/5 (38)
The shape of the chi-square distribution depends on the number of degrees of freedom.
(True/False)
4.9/5 (37)
A frequency distribution has a mean of 100 and a standard deviation of 20. The class limits for one class are 50 up to 60. What are the standard normal z-statistics for the class limits?
(Multiple Choice)
4.8/5 (27)
A scatter plot is a useful graphical method to determine if a set of sample data is from a normal population.
(True/False)
4.8/5 (27)
To determine if a set of ungrouped, raw data is normally distributed, the cumulative relative frequency distribution of the raw data is compared to a ____________.
(Multiple Choice)
5.0/5 (42)
In a goodness-of-fit test, the null hypothesis (no difference between sets of observed and expected frequencies) is rejected when the ________________.
(Multiple Choice)
4.7/5 (29)
A personnel manager is concerned about absenteeism. She decides to sample employee records to determine if absenteeism is distributed evenly throughout the six-day workweek. The null hypothesis is: Absenteeism is distributed evenly throughout the week. Use the 0.01 level of significance. The sample results are: 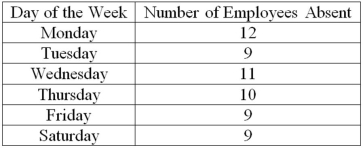 How many degrees of freedom are there?
(Multiple Choice)
4.8/5 (34)
Recently, students in a marketing research class were interested in the driving behavior of students. Specifically, the marketing students were interested in finding out if exceeding the speed limit was related to social activity. They collected the following responses from 100 randomly selected students: 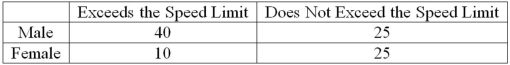 Using 0.05 as the significance level, what is the critical value for the test statistic?
(Multiple Choice)
4.8/5 (35)
A recent study of the relationship between social activity and education for a sample of corporate executives showed the following results. 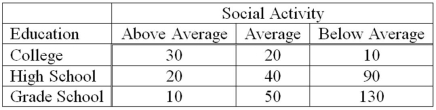 What is the value of the chi-square test statistic?
(Multiple Choice)
4.7/5 (40)
The use of the chi-square statistic would be permissible in the following goodness-of-fit test. 
(True/False)
4.8/5 (36)
If an employee wanted to investigate the relationship between performance rating and gender, what type of analysis should be used?
(Essay)
4.9/5 (33)
To verify that an observed frequency distribution is normally distributed, a ________ statistic is used to test the hypothesis that the sample data is normally distributed.
(Short Answer)
4.9/5 (37)
Filters
- Essay(0)
- Multiple Choice(0)
- Short Answer(0)
- True False(0)
- Matching(0)