Exam 2: Describing Data: Frequency Tables, Frequency Distributions, and Graphic Presentation
Exam 1: What Is Statistics79 Questions
Exam 2: Describing Data: Frequency Tables, Frequency Distributions, and Graphic Presentation129 Questions
Exam 3: Describing Data: Numerical Measures117 Questions
Exam 4: Describing Data: Displaying and Exploring Data92 Questions
Exam 5: A Survey of Probability Concepts121 Questions
Exam 6: Discrete Probability Distributions114 Questions
Exam 7: Continuous Probability Distributions100 Questions
Exam 8: Sampling Methods and the Central Limit Theorem114 Questions
Exam 9: Estimation and Confidence Intervals114 Questions
Exam 10: One-Sample Tests of Hypothesis129 Questions
Exam 11: Two-Sample Tests of Hypothesis122 Questions
Exam 12: Analysis of Variance92 Questions
Exam 13: Correlation and Linear Regression130 Questions
Exam 14: Multiple Regression Analysis122 Questions
Exam 15: Nonparametric Methods: Goodness-Of-Fit Tests128 Questions
Select questions type
When data is collected using a qualitative, nominal variable (in other words, male or female), what is true about a frequency distribution that summarizes the data?
Free
(Multiple Choice)
5.0/5  (37)
(37)
Correct Answer: Verified
C
A small sample of computer operators shows monthly incomes of $1,950, $1,775, $2,060, $1,840, $1,795, $1,890, $1,925, and $1,810. What are these ungrouped numbers called?
Free
(Multiple Choice)
4.7/5 (41)
Correct Answer:Verified
D
A _____ chart is useful for displaying a frequency distribution for a qualitative variable.
Free
(Short Answer)
4.7/5 (42)
Correct Answer:Verified
Bar
A student was interested in the cigarette smoking habits of college students and collected data from an unbiased random sample of students. The data is summarized in the following table: 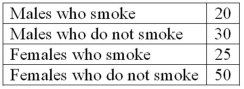 What type of chart best represents the frequency table?
(Multiple Choice)
4.7/5 (32)
A group of 100 students was surveyed about their interest in a new International Studies program. Interest was measured in terms of high, medium, or low. In the study, 30 students responded high interest, 40 students responded medium interest, and 30 students responded low interest. What is the relative frequency of students with high interest?
(Multiple Choice)
4.7/5 (41)
Refer to the following information from a frequency distribution for "heights of college women" recorded to the nearest inch: the first two class midpoints are 62.5" and 65.5". What are the class limits for the lowest class?
(Multiple Choice)
4.9/5 (42)
In a bar chart, the x-axis is labeled with the values of a qualitative variable.
(True/False)
4.8/5 (31)
Refer to the following breakdown of responses to a survey of "Are you concerned about being tracked while connected to the Internet?" 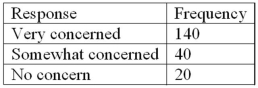 What is the class with the greatest frequency?
(Multiple Choice)
4.8/5 (30)
For a frequency distribution of quantitative data, if every individual, object, or measurement can be assigned to a class, the frequency distribution is __________.
(Short Answer)
4.9/5 (38)
Refer to the following information from a frequency distribution for "heights of college women" recorded to the nearest inch: the first two class midpoints are 62.5" and 65.5". What are the class limits for the third class?
(Multiple Choice)
4.7/5 (39)
Refer to the following breakdown of responses to a survey of room cleanliness in a hotel. 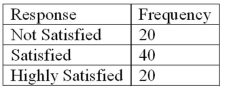 What is the class with the greatest frequency?
(Short Answer)
4.8/5 (36)
Refer to the following breakdown of responses to a survey of room cleanliness in a hotel. 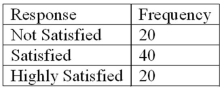 What percent of the responses indicated that customers were satisfied?
(Short Answer)
4.9/5 (40)
Refer to the following frequency distribution on days absent during a calendar year by employees of a manufacturing company: 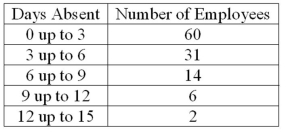 How many employees were absent fewer than six days?
(Multiple Choice)
4.9/5 (32)
What is the difference between a frequency distribution and a cumulative frequency distribution?
(Essay)
4.9/5 (32)
Refer to the following distribution of commissions: 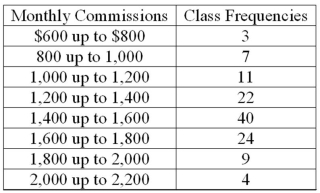 For the preceding distribution, what is the midpoint of the class with the greatest frequency?
(Multiple Choice)
4.9/5 (31)
In a frequency distribution, the number of observations in a class is called the class ________.
(Multiple Choice)
4.7/5 (40)
To summarize the gender of students attending a college, the number of classes in a frequency distribution depends on the number of students.
(True/False)
4.8/5 (44)
To construct a pie chart, the class frequencies are converted to __________.
(Short Answer)
4.8/5 (27)
Refer to the following breakdown of responses to a survey of "Are you concerned about being tracked while connected to the Internet?" 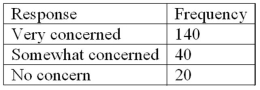 What type of chart should be used to show relative class frequencies?
(Multiple Choice)
4.7/5 (44)
When classes in a frequency table are constructed so that each observation will fit into only one class, the categories are ______________________.
(Short Answer)
4.9/5 (38)
Filters
- Essay(0)
- Multiple Choice(0)
- Short Answer(0)
- True False(0)
- Matching(0)