Exam 15: Nonparametric Methods: Goodness-Of-Fit Tests
Exam 1: What Is Statistics79 Questions
Exam 2: Describing Data: Frequency Tables, Frequency Distributions, and Graphic Presentation129 Questions
Exam 3: Describing Data: Numerical Measures117 Questions
Exam 4: Describing Data: Displaying and Exploring Data92 Questions
Exam 5: A Survey of Probability Concepts121 Questions
Exam 6: Discrete Probability Distributions114 Questions
Exam 7: Continuous Probability Distributions100 Questions
Exam 8: Sampling Methods and the Central Limit Theorem114 Questions
Exam 9: Estimation and Confidence Intervals114 Questions
Exam 10: One-Sample Tests of Hypothesis129 Questions
Exam 11: Two-Sample Tests of Hypothesis122 Questions
Exam 12: Analysis of Variance92 Questions
Exam 13: Correlation and Linear Regression130 Questions
Exam 14: Multiple Regression Analysis122 Questions
Exam 15: Nonparametric Methods: Goodness-Of-Fit Tests128 Questions
Select questions type
Contingency table analysis can be used to test for a relationship between two _________ scale variables.
(Short Answer)
4.9/5  (27)
(27)
The shape of the chi-square distribution depends on the size of the sample.
(True/False)
4.7/5 (34)
What are the degrees of freedom for a contingency table analysis?
(Multiple Choice)
4.8/5 (34)
The degrees of freedom for a chi-square goodness-of-fit test is equal to ______________.
(Short Answer)
4.8/5 (28)
For people released from prison, the following table shows their adjustment to civilian life and place of residence. 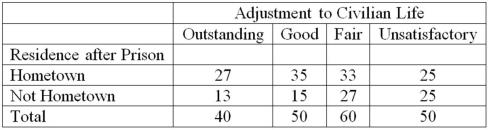 What is the critical value for this contingency table at the 0.01 level of significance?
(Multiple Choice)
4.8/5 (36)
The computed value of a chi-square statistic is always positive because the numerator is the difference between the observed frequencies and the expected frequencies ______________.
(Short Answer)
4.9/5 (39)
There is not one, but a family of chi-square distributions. There is a chi-square distribution for 1 degree of freedom, another for 2 degrees of freedom, another for 3 degrees of freedom, and so on.
(True/False)
4.9/5 (31)
Which of the following statements is correct regarding the goodness-of-fit test?
(Multiple Choice)
4.7/5 (29)
In a contingency table, the decision to reject the null hypothesis is based on a __________ test statistic.
(Short Answer)
4.7/5 (43)
For hypothesis tests using a chi-square statistic, the rejection region is in the _____________ tail of the chi-square distribution.
(Short Answer)
4.9/5 (29)
A recent study of the relationship between social activity and education for a sample of corporate executives showed the following results. 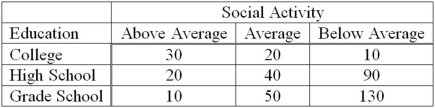 The appropriate test to analyze the relationship between social activity and education is __________.
(Multiple Choice)
4.8/5 (34)
To verify that a frequency distribution for sample data is normally distributed, the expected frequencies are computed using probabilities from a _____________ distribution.
(Short Answer)
4.8/5 (27)
The contingency table for a sample of corporate executives classified by educational level and the social activity follows. 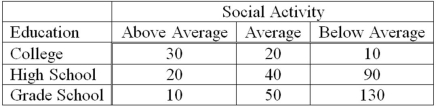 What does the expected frequency for the "above average" social activity and "high school" education equal?
(Multiple Choice)
4.9/5 (28)
To determine if a set of ungrouped raw data is normally distributed, what test statistic would we use?
(Multiple Choice)
4.9/5 (42)
A survey of property owners' opinions about a street-widening project was taken to determine if owners' opinions were related to the distance between their home and the street. A randomly selected sample of 100 property owners was contacted and the results are shown next. 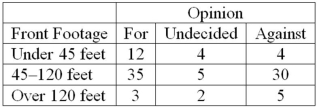 This classification is summarized with what kind of table?
(Short Answer)
4.9/5 (33)
To determine if a set of ungrouped raw data is normally distributed, the null hypothesis is ________________.
(Multiple Choice)
4.8/5 (34)
Which of the following can be used to test the hypothesis that two nominal variables are related?
(Multiple Choice)
4.9/5 (30)
A personnel manager is concerned about absenteeism. She decides to sample employee records to determine if absenteeism is distributed evenly throughout the six-day workweek. The null hypothesis is: Absenteeism is distributed evenly throughout the week. The 0.01 level is to be used. The sample results are: 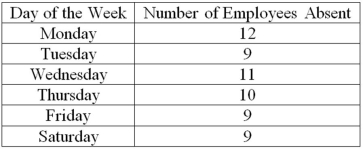 What kind of frequencies are the numbers 12, 9, 11, 10, 9, and 9 called?
(Multiple Choice)
4.8/5 (30)
The Anderson-Darling test for normality tests a null hypothesis that the sample data are ______ distributed.
(Short Answer)
4.9/5 (37)
A survey of property owners' opinions about a street-widening project was taken to determine if owners' opinions were related to the distance between their home and the street. A randomly selected sample of 100 property owners was contacted and the results are shown next. 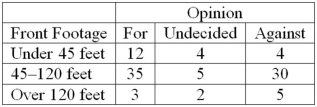 What is the expected frequency for people who are undecided about the project and have property front-footage between 45 and 120 feet?
(Multiple Choice)
4.8/5 (33)
Filters
- Essay(0)
- Multiple Choice(0)
- Short Answer(0)
- True False(0)
- Matching(0)