Exam 13: Correlation and Linear Regression
Exam 1: What Is Statistics79 Questions
Exam 2: Describing Data: Frequency Tables, Frequency Distributions, and Graphic Presentation129 Questions
Exam 3: Describing Data: Numerical Measures117 Questions
Exam 4: Describing Data: Displaying and Exploring Data92 Questions
Exam 5: A Survey of Probability Concepts121 Questions
Exam 6: Discrete Probability Distributions114 Questions
Exam 7: Continuous Probability Distributions100 Questions
Exam 8: Sampling Methods and the Central Limit Theorem114 Questions
Exam 9: Estimation and Confidence Intervals114 Questions
Exam 10: One-Sample Tests of Hypothesis129 Questions
Exam 11: Two-Sample Tests of Hypothesis122 Questions
Exam 12: Analysis of Variance92 Questions
Exam 13: Correlation and Linear Regression130 Questions
Exam 14: Multiple Regression Analysis122 Questions
Exam 15: Nonparametric Methods: Goodness-Of-Fit Tests128 Questions
Select questions type
The standard error of estimate measures the accuracy of a prediction.
(True/False)
4.9/5  (39)
(39)
If the slope of a regression line is zero, the orientation of the regression line is _________, which indicates a lack of a relationship.
(Short Answer)
4.8/5 (36)
High school students were interested in a teacher's claim that the longer the length of time (hours) that a student studies for a test, the higher the test score. The students collected the data and the teacher did the regression analysis with the following results. 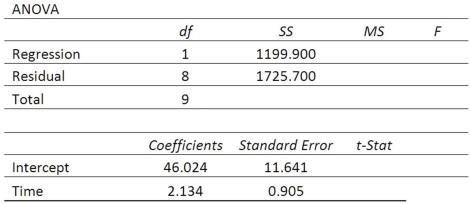 If a student studies 10 hours, what is the predicted score?
(Short Answer)
4.8/5 (40)
A company wants to study the effect of an employee's length of employment on their number of workdays absent. The company collected the following information on a random sample of seven employees. 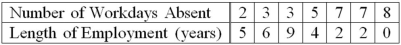 What is the dependent variable (Y)?
(Short Answer)
4.8/5 (34)
If r = 0.65, what does the coefficient of determination equal?
(Multiple Choice)
4.9/5 (35)
Which of the following is true about the standard error of estimate?
(Multiple Choice)
4.8/5 (40)
The coefficient of determination is the proportion of total variation in Y that is explained by X.
(True/False)
4.8/5 (34)
If we reject the null hypothesis, H0:  , what can we conclude about the population correlation coefficient?
(Multiple Choice)
4.9/5 (33)
Approximately ______% of the observations lies within two standard errors of the regression line.
(Short Answer)
4.9/5 (27)
Using the following information: 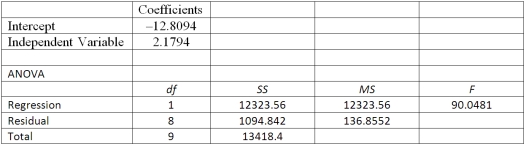 What is the correlation coefficient?
(Multiple Choice)
4.9/5 (34)
Using the following regression analysis: 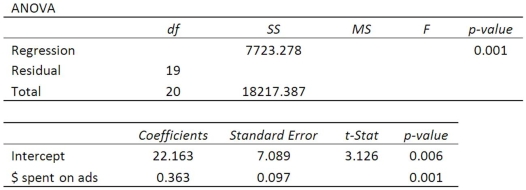 What is the regression mean square?
(Short Answer)
4.8/5 (34)
A sales manager for an advertising agency believes that there is a relationship between the number of contacts that a salesperson makes and the amount of sales dollars earned. A regression ANOVA shows the following results: 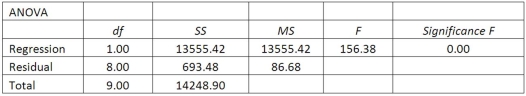 What is the value of the coefficient of determination?
(Multiple Choice)
4.8/5 (36)
What is the range of values for the coefficient of determination?
(Multiple Choice)
4.8/5 (35)
A sales manager for an advertising agency believes that there is a relationship between the number of contacts that a salesperson makes and the amount of sales dollars earned. A regression analysis shows the following results: 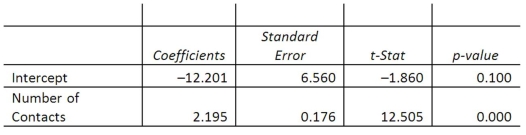 What is the decision regarding the hypothesis that the slope equals zero?
(Multiple Choice)
4.7/5 (34)
A company wants to study the effect of an employee's length of employment on their number of workdays absent. The results of the regression analysis follow. 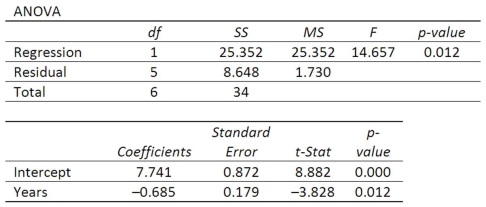 What is the Y-intercept of the linear equation?
(Short Answer)
4.8/5 (28)
In plotting paired data in a scatter diagram, the dependent variable is scaled on the __________________.
(Short Answer)
4.8/5 (34)
A sales manager for an advertising agency believes that there is a relationship between the number of contacts that a salesperson makes and the amount of sales dollars earned. A regression analysis shows the following results: 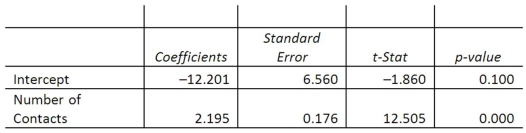 What is the standard error of the slope?
(Multiple Choice)
4.8/5 (33)
Using the following regression analysis: 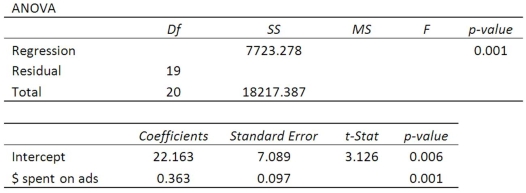 What is the F-statistic for the ANOVA?
(Short Answer)
4.9/5 (40)
A regression analysis yields the following information: 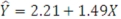 ; n = 10; sy∙x = 1.66; ΣX = 32; ΣX2 = 134;
 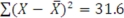 Compute the 95% prediction interval when X = 4.
(Multiple Choice)
4.8/5 (34)
The relationship between interest rates as a percent (X) and housing starts (Y) is given by the linear equation Ŷ = 4094 - 269X. What will be the number of housing starts if the interest rate is 8.25%?
(Short Answer)
4.8/5 (33)
Filters
- Essay(0)
- Multiple Choice(0)
- Short Answer(0)
- True False(0)
- Matching(0)