Exam 21: The Influence of Monetary and Fiscal Policy on Aggregate Demand
Exam 1: Ten Principles of Economics438 Questions
Exam 2: Thinking Like an Economist620 Questions
Exam 3: Interdependence and the Gains From Trade527 Questions
Exam 4: The Market Forces of Supply and Demand700 Questions
Exam 5: Elasticity and Its Application598 Questions
Exam 6: Supply, Demand, and Government Policies648 Questions
Exam 7: Consumers, Producers, and the Efficiency of Markets547 Questions
Exam 8: Application: the Costs of Taxation514 Questions
Exam 9: Application: International Trade496 Questions
Exam 10: Measuring a Nations Income522 Questions
Exam 11: Measuring the Cost of Living545 Questions
Exam 12: Production and Growth507 Questions
Exam 13: Saving, Investment, and the Financial System567 Questions
Exam 14: The Basic Tools of Finance513 Questions
Exam 15: Unemployment699 Questions
Exam 16: The Monetary System517 Questions
Exam 17: Money Growth and Inflation487 Questions
Exam 18: Open-Economy Macroeconomics: Basic Concepts522 Questions
Exam 19: A Macroeconomic Theory of the Open Economy484 Questions
Exam 20: Aggregate Demand and Aggregate Supply563 Questions
Exam 21: The Influence of Monetary and Fiscal Policy on Aggregate Demand511 Questions
Exam 22: The Short-Run Trade-Off Between Inflation and Unemployment516 Questions
Exam 23: Six Debates Over Macroeconomic Policy372 Questions
Select questions type
Initially, the economy is in long-run equilibrium. The aggregate demand curve then shifts $80 billion to the left. The government wants to change spending to offset this decrease in demand. The MPC is 0.75. Suppose the effect on aggregate demand of a tax change is 3/4 as strong as the effect of a change in government expenditure. There is no crowding out and no accelerator effect. What should the government do if it wants to offset the decrease in real GDP?
(Multiple Choice)
4.8/5  (38)
(38)
According to liquidity preference theory, the money-supply curve would shift if the Fed
(Multiple Choice)
4.8/5 (42)
The potential positive feedback that government spending may have on investment is known as the _____. The potential negative effect that government spending may have on investment is known as the _____ effect.
(Essay)
4.8/5 (34)
According to the interest-rate effect, an increase in the price level will
(Multiple Choice)
4.8/5 (42)
In principle, the government could increase the money supply or increase government expenditures to try to offset the effects of a wave of pessimism about the future of the economy.
(True/False)
4.9/5 (31)
The idea that a decrease in the price level raises the real value of households' money holdings, which increases consumer spending and the quantity of goods and services demanded is known as
(Multiple Choice)
4.8/5 (51)
The theory of liquidity preference was developed by Irving Fisher.
(True/False)
4.9/5 (41)
Scenario 34-2. The following facts apply to a small, imaginary economy.
• Consumption spending is $6,720 when income is $8,000.
• Consumption spending is $7,040 when income is $8,500.
-Refer to Scenario 34-2. The multiplier for this economy is
(Multiple Choice)
4.9/5 (37)
In order to simplify the equation for the multiplier to its familiar, relatively simple form, we make use of the
(Multiple Choice)
4.7/5 (37)
Figure 34-12 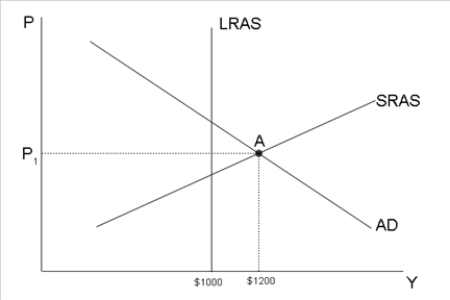 -Refer to Figure 34-12. Suppose the multiplier is 5 and the economy is currently at point A. To stabilize output at $1000, the government should _____ purchases by $_____.
(Essay)
4.8/5 (34)
In which of the following cases does the aggregate-demand curve shift to the right?
(Multiple Choice)
4.7/5 (51)
Figure 34-6. On the left-hand graph, MS represents the supply of money and MD represents the demand for money; on the right-hand graph, AD represents aggregate demand. The usual quantities are measured along the axes of both graphs.
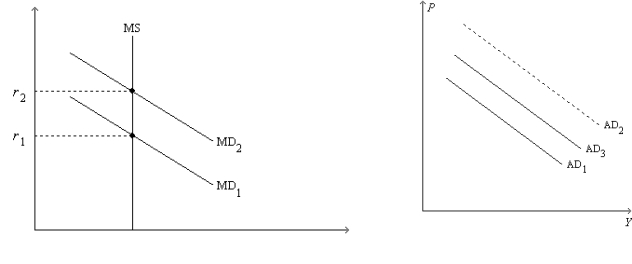 -Refer to Figure 34-6. Suppose the multiplier is 5 and the government increases its purchases by $15 billion. Also, suppose the AD curve would shift from AD1 to AD2 if there were no crowding out; the AD curve actually shifts from AD1 to AD3 with crowding out. Also, suppose the horizontal distance between the curves AD1 and AD3 is $55 billion. The extent of crowding out, for any particular level of the price level, is
(Multiple Choice)
4.9/5 (39)
Assuming no crowding-out, investment-accelerator, or multiplier effects, a $100 billion increase in government expenditures shifts aggregate demand
(Multiple Choice)
4.9/5 (35)
The wealth effect helps explain the slope of the aggregate-demand curve. This effect is
(Multiple Choice)
4.7/5 (38)
Figure 34-2. On the left-hand graph, MS represents the supply of money and MD represents the demand for money; on the right-hand graph, AD represents aggregate demand. The usual quantities are measured along the axes of both graphs.
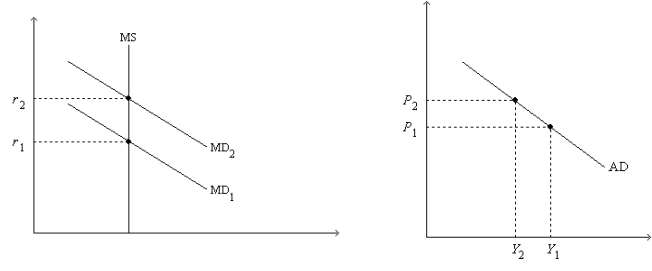 -Refer to Figure 34-2. As we move from one point to another along the money-demand curve MD1,
(Multiple Choice)
4.9/5 (35)
During a recession unemployment benefits rise. This rise in benefits makes aggregate demand higher than otherwise.
(True/False)
4.8/5 (39)
Filters
- Essay(0)
- Multiple Choice(0)
- Short Answer(0)
- True False(0)
- Matching(0)