Exam 21: The Influence of Monetary and Fiscal Policy on Aggregate Demand
Exam 1: Ten Principles of Economics438 Questions
Exam 2: Thinking Like an Economist620 Questions
Exam 3: Interdependence and the Gains From Trade527 Questions
Exam 4: The Market Forces of Supply and Demand700 Questions
Exam 5: Elasticity and Its Application598 Questions
Exam 6: Supply, Demand, and Government Policies648 Questions
Exam 7: Consumers, Producers, and the Efficiency of Markets547 Questions
Exam 8: Application: the Costs of Taxation514 Questions
Exam 9: Application: International Trade496 Questions
Exam 10: Measuring a Nations Income522 Questions
Exam 11: Measuring the Cost of Living545 Questions
Exam 12: Production and Growth507 Questions
Exam 13: Saving, Investment, and the Financial System567 Questions
Exam 14: The Basic Tools of Finance513 Questions
Exam 15: Unemployment699 Questions
Exam 16: The Monetary System517 Questions
Exam 17: Money Growth and Inflation487 Questions
Exam 18: Open-Economy Macroeconomics: Basic Concepts522 Questions
Exam 19: A Macroeconomic Theory of the Open Economy484 Questions
Exam 20: Aggregate Demand and Aggregate Supply563 Questions
Exam 21: The Influence of Monetary and Fiscal Policy on Aggregate Demand511 Questions
Exam 22: The Short-Run Trade-Off Between Inflation and Unemployment516 Questions
Exam 23: Six Debates Over Macroeconomic Policy372 Questions
Select questions type
If expected inflation is constant, then when the nominal interest rate increases, the real interest rate
(Multiple Choice)
4.9/5  (47)
(47)
One of President Obama's first policy initiatives was a stimulus bill that included large increases in government spending.
(True/False)
4.8/5 (34)
Suppose aggregate demand shifts to the left and policymakers want to stabilize output. What can they do?
(Multiple Choice)
4.8/5 (24)
Sometimes during wars, government expenditures are larger than normal. To reduce the effects this spending creates on interest rates,
(Multiple Choice)
4.8/5 (42)
If the Federal Reserve's goal is to stabilize aggregate demand, then in response to an increase in money demand, the Federal Reserve will _____ the money supply.
(Essay)
4.7/5 (54)
In 1961, President John F. Kennedy, acting upon advice from his economists, proposed tax cuts. The advice he received
(Multiple Choice)
4.7/5 (39)
According to the theory of liquidity preference, a decrease in the price level causes the
(Multiple Choice)
4.9/5 (35)
The change in aggregate demand that results from fiscal expansion changing the interest rate is called the
(Multiple Choice)
4.9/5 (36)
If the Federal Reserve increases the money supply, then initially there is a
(Multiple Choice)
4.9/5 (43)
Figure 34-2. On the left-hand graph, MS represents the supply of money and MD represents the demand for money; on the right-hand graph, AD represents aggregate demand. The usual quantities are measured along the axes of both graphs.
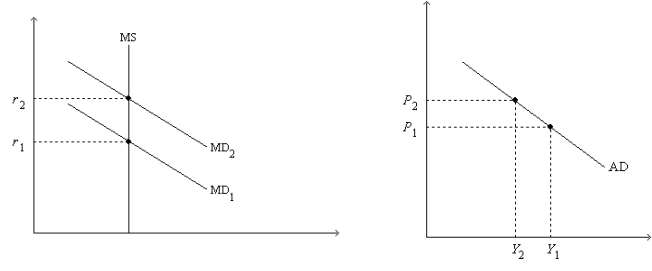 -Refer to Figure 34-2. Which of the following quantities is held constant as we move from one point to another on either graph?
(Multiple Choice)
4.7/5 (31)
If the multiplier is 6 and if there is no crowding-out effect, then a $60 billion increase in government expenditures causes aggregate demand to
(Multiple Choice)
4.8/5 (49)
According to liquidity preference theory, the money-supply curve is
(Multiple Choice)
4.7/5 (49)
Suppose that consumers become pessimistic about the future health of the economy. What will happen to aggregate demand and to output? What might the president and Congress have to do to keep output stable?
(Essay)
4.8/5 (41)
Other things the same, which of the following happens if the price level rises?
(Multiple Choice)
4.9/5 (42)
Filters
- Essay(0)
- Multiple Choice(0)
- Short Answer(0)
- True False(0)
- Matching(0)