Exam 21: The Influence of Monetary and Fiscal Policy on Aggregate Demand
Exam 1: Ten Principles of Economics438 Questions
Exam 2: Thinking Like an Economist620 Questions
Exam 3: Interdependence and the Gains From Trade527 Questions
Exam 4: The Market Forces of Supply and Demand700 Questions
Exam 5: Elasticity and Its Application598 Questions
Exam 6: Supply, Demand, and Government Policies648 Questions
Exam 7: Consumers, Producers, and the Efficiency of Markets547 Questions
Exam 8: Application: the Costs of Taxation514 Questions
Exam 9: Application: International Trade496 Questions
Exam 10: Measuring a Nations Income522 Questions
Exam 11: Measuring the Cost of Living545 Questions
Exam 12: Production and Growth507 Questions
Exam 13: Saving, Investment, and the Financial System567 Questions
Exam 14: The Basic Tools of Finance513 Questions
Exam 15: Unemployment699 Questions
Exam 16: The Monetary System517 Questions
Exam 17: Money Growth and Inflation487 Questions
Exam 18: Open-Economy Macroeconomics: Basic Concepts522 Questions
Exam 19: A Macroeconomic Theory of the Open Economy484 Questions
Exam 20: Aggregate Demand and Aggregate Supply563 Questions
Exam 21: The Influence of Monetary and Fiscal Policy on Aggregate Demand511 Questions
Exam 22: The Short-Run Trade-Off Between Inflation and Unemployment516 Questions
Exam 23: Six Debates Over Macroeconomic Policy372 Questions
Select questions type
Figure 34-10 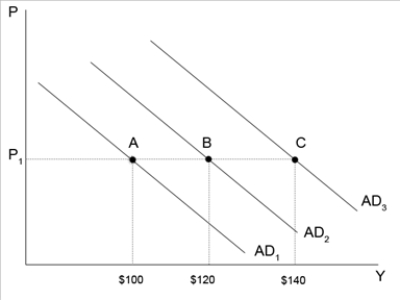 -Refer to Figure 34-10. Suppose the multiplier is 4 and the economy is currently at point A. An increase in government purchases of $10 will increase aggregate demand to $ if there is no crowding-out. If crowding- out exists, then aggregate demand will likely to increase to $ .
(Essay)
4.9/5  (33)
(33)
When the interest rate increases, the opportunity cost of holding money
(Multiple Choice)
4.8/5 (40)
Fiscal policy refers to the idea that aggregate demand is affected by changes in
(Multiple Choice)
4.9/5 (38)
Figure 34-8 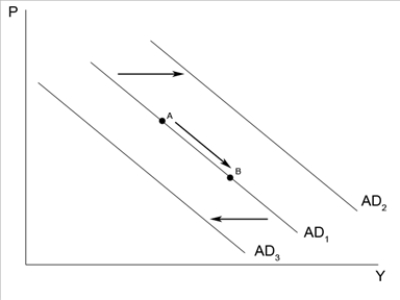 -Refer to Figure 34-8. An increase in government purchases will
(Multiple Choice)
4.9/5 (27)
The lag problem associated with monetary policy is due mostly to
(Multiple Choice)
4.8/5 (31)
According to the theory of liquidity preference, if the interest rate rises
(Multiple Choice)
4.9/5 (38)
According to the theory of liquidity preference, the interest rate adjusts to balance the supply of, and demand for, loanable funds.
(True/False)
5.0/5 (36)
The interest rate that the Federal Reserve pays banks on the reserves they hold is called the
(Multiple Choice)
4.8/5 (32)
The additional shifts in aggregate demand that result when there is an increase in government spending is known as the _____.
(Essay)
4.8/5 (44)
In response to the sharp decline in stock prices in October 1987, the Federal Reserve
(Multiple Choice)
4.8/5 (38)
Suppose an increase in interest rates causes rising unemployment and falling output. To counter this, the Federal Reserve would
(Multiple Choice)
4.9/5 (42)
Figure 34-2. On the left-hand graph, MS represents the supply of money and MD represents the demand for money; on the right-hand graph, AD represents aggregate demand. The usual quantities are measured along the axes of both graphs.
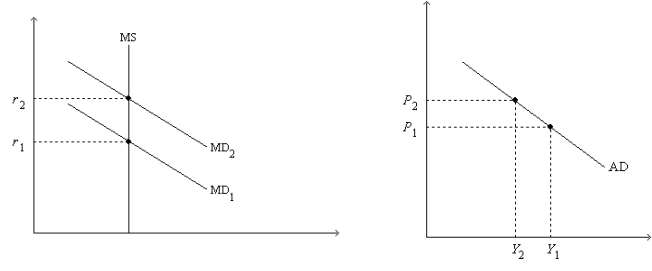 -Refer to Figure 34-2. What is measured along the horizontal axis of the left-hand graph?
(Multiple Choice)
4.8/5 (43)
As the MPC gets close to 1, the value of the multiplier approaches
(Multiple Choice)
4.8/5 (33)
Changes in monetary policy aimed at reducing aggregate demand involve decreasing the money supply or increasing the interest rate.
(True/False)
4.8/5 (35)
The main criticism of those who doubt the ability of the government to respond in a useful way to the business cycle is that the theory by which money and government expenditures change output is flawed.
(True/False)
4.9/5 (38)
If the Federal Reserve decreases the money supply, then initially there is a
(Multiple Choice)
4.8/5 (38)
Filters
- Essay(0)
- Multiple Choice(0)
- Short Answer(0)
- True False(0)
- Matching(0)