Exam 12: Time Series Analysis and Forecasting
Exam 1: Introduction to Data Analysis and Decision Making30 Questions
Exam 2: Describing the Distribution of a Single Variable97 Questions
Exam 3: Finding Relationships Among Variables84 Questions
Exam 4: Probability and Probability Distributions113 Questions
Exam 5: Normal, binomial, poisson, and Exponential Distributions118 Questions
Exam 6: Decision Making Under Uncertainty106 Questions
Exam 7: Sampling and Sampling Distributions92 Questions
Exam 8: Confidence Interval Estimation85 Questions
Exam 9: Hypothesis Testing85 Questions
Exam 10: Regression Analysis: Estimating Relationships97 Questions
Exam 11: Regression Analysis: Statistical Inference87 Questions
Exam 12: Time Series Analysis and Forecasting104 Questions
Exam 13: Introduction to Optimization Modeling91 Questions
Exam 14: Optimization Modeling: Applications115 Questions
Exam 15: Introduction to Simulation Modeling81 Questions
Exam 16: Simulation Models104 Questions
Select questions type
A trend component of a time series is a long-term,relatively smooth pattern or direction exhibited by a series,and its duration is more than one year.
(True/False)
4.8/5  (44)
(44)
When using exponential smoothing,a smoothing constant  must be used.The value for
  :
:
(Multiple Choice)
4.8/5 (46)
(A)Is this time series random? Perform a runs test and compute a few autocorrelations to support your answer.
(B)Does a linear trend appear to fit these data well? If so,estimate the linear-trend model for this time series,and interpret the  value.
(C)Is there evidence of some seasonal pattern in these sales data? If so,characterize the seasonal pattern,and explain how to forecast future values.
value.
(C)Is there evidence of some seasonal pattern in these sales data? If so,characterize the seasonal pattern,and explain how to forecast future values.
(Essay)
4.9/5 (33)
When using exponential smoothing,if you want the forecast to react quickly to movements in the series,you should choose:
(Multiple Choice)
4.9/5 (38)
Regression models with seasonal dummy variables produce coefficients for each quarter,which represent the additive or multiplicative factors relative to the annual average.
(True/False)
4.7/5 (42)
A linear trend means that the time series variable changes by a:
(Multiple Choice)
5.0/5 (40)
Holt's method is an exponential smoothing method,which is appropriate for a series with seasonality and possibly a trend.
(True/False)
4.8/5 (34)
Which of the following is not a method for dealing with seasonality in data
(Multiple Choice)
4.9/5 (43)
To deseasonalize an observation (assuming a multiplicative model of seasonality),multiply it by the appropriate seasonal index.
(True/False)
4.7/5 (44)
The moving average method is perhaps the simplest and one of the most frequently-used extrapolation methods.
(True/False)
4.8/5 (37)
If we use a value close to 1 for the level smoothing constant  and a value close to 0 for the trend smoothing constant
  in Holt's exponential smoothing model,then we expect the model to respond very quickly to changes in the level,but very slowly to changes in the trend.
(True/False)
4.8/5 (41)
Run the moving average fit again,this time holding out the last 6 observations to validate the fit.What do you find?
(Essay)
4.8/5 (36)
Suppose that a simple exponential smoothing model is used (with a = 0.30)to forecast monthly sandwich sales at a local sandwich shop.After June's demand is observed at 1520 sandwiches,the forecasted demand for July is 1600 sandwiches.At the beginning of July,what would be the forecasted demand for August?
(Multiple Choice)
4.8/5 (29)
Simple exponential smoothing is appropriate for a series without a pronounced trend or seasonality.
(True/False)
4.9/5 (40)
Forecasting software packages typically report several summary measures of the forecasting error.The most important of these are MAE (mean absolute error),RMSE (root mean square error),and MAPE (mean absolute percentage error).
(True/False)
4.8/5 (32)
The number of reported accidents at a manufacturing plant located in Flint,Michigan,was recorded at the start of each month.These data are provided in the table below: 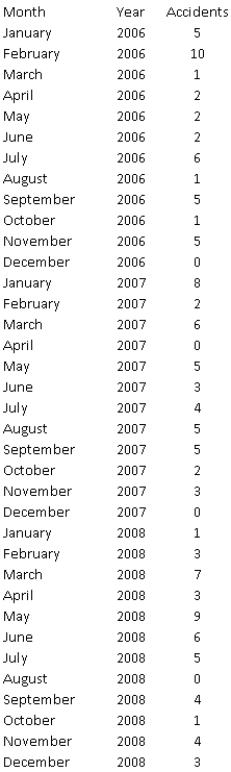 Is this time series random? Perform a runs test and compute a few autocorrelations to support your answer.
(Essay)
4.7/5 (29)
Obtain a time series graph of the data.If you will be using a moving average model of the data,what information does this graph provide to help specify such a model?
(Essay)
4.9/5 (44)
Filters
- Essay(0)
- Multiple Choice(0)
- Short Answer(0)
- True False(0)
- Matching(0)