Exam 12: Time Series Analysis and Forecasting
Exam 1: Introduction to Data Analysis and Decision Making30 Questions
Exam 2: Describing the Distribution of a Single Variable97 Questions
Exam 3: Finding Relationships Among Variables84 Questions
Exam 4: Probability and Probability Distributions113 Questions
Exam 5: Normal, binomial, poisson, and Exponential Distributions118 Questions
Exam 6: Decision Making Under Uncertainty106 Questions
Exam 7: Sampling and Sampling Distributions92 Questions
Exam 8: Confidence Interval Estimation85 Questions
Exam 9: Hypothesis Testing85 Questions
Exam 10: Regression Analysis: Estimating Relationships97 Questions
Exam 11: Regression Analysis: Statistical Inference87 Questions
Exam 12: Time Series Analysis and Forecasting104 Questions
Exam 13: Introduction to Optimization Modeling91 Questions
Exam 14: Optimization Modeling: Applications115 Questions
Exam 15: Introduction to Simulation Modeling81 Questions
Exam 16: Simulation Models104 Questions
Select questions type
A car dealer in Big Rapids,Michigan is using Holt's method to forecast weekly car sales.Currently the level is estimated to be 45 cars per week,and the trend is estimated to be 5 cars per week.During the current week,25 cars are sold.After observing the current week's sales,forecast the number of cars three weeks from now.Use  .
.
(Essay)
4.9/5  (35)
(35)
In contrast to linear trend,exponential trend is appropriate when the time series changes by a:
(Multiple Choice)
4.9/5 (31)
There are a variety of deseasonalizing methods,but they are typically variations of:
(Multiple Choice)
4.8/5 (33)
Every form of exponential smoothing model has at least one smoothing constant,which is always between 0 and 1.
(True/False)
4.8/5 (40)
The idea behind the runs test is that a random number series should have a number of runs that is:
(Multiple Choice)
4.8/5 (34)
Related to the runs test,if T is reasonably large (T > 20 is suggested),then the statistic can be used to perform this test.
(Multiple Choice)
4.8/5 (36)
(A)Fit the appropriate regression model to the data.Report the resulting equation and state explicitly what it says about the percentage growth per month.
(B)What is the MAPE for the forecast model in (A)? What does it measure? Considering its magnitudes,does the model seem to be doing a good job?
(Essay)
4.8/5 (32)
The time series component that reflects a long-term,relatively smooth pattern or direction exhibited by a time series over a long time period,is called seasonal.
(True/False)
4.8/5 (40)
The most common form of autocorrelation is positive autocorrelation,where large observations tend to follow large observations and small observations tend to follow small observations.
(True/False)
4.7/5 (38)
We compute the five-period moving averages for all time periods except the first two.
(True/False)
4.8/5 (39)
Which of the following is not one of the techniques that can be used to identify whether a time series is truly random?
(Multiple Choice)
4.9/5 (44)
Extrapolation forecasting methods are quantitative methods that use past data of a time series variable - and nothing else,except possible time itself - to forecast values of the variable.
(True/False)
4.9/5 (35)
If a random series has too few runs,then it is zigzagging too often.
(True/False)
4.8/5 (40)
The following are the values of a time series for the first four time periods: 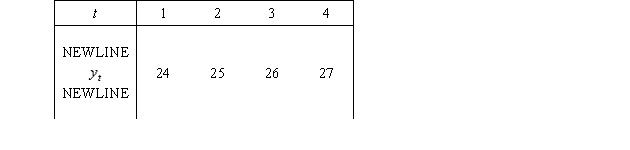 Using a four-period moving average,the forecasted value for time period 5 is:
(Multiple Choice)
4.9/5 (34)
You will always get more accurate forecasts by using more complex forecasting methods.
(True/False)
4.8/5 (36)
In a regression model with seasonal dummy variables,the coefficients on the dummy variables represent the additive factor relative to the reference quarter value,not the multiplicative factor.
(True/False)
4.7/5 (39)
(A)Suppose that actual demands during April and May are as follows: May,5500 cans; June 4500 cans.After observing May's demand,what is the forecast for June's demand?
(B)Based on the data from (A),the demands during April and May average (5500+4500)/2 = 5000 cans per month.This is the same as the forecast for monthly sales before we observed the April and May data.Yet after we observed the April and May demands for Pepsi,our forecast for June demand has decreased from what it was at the end of March.Why?
(Essay)
4.8/5 (37)
The seasonal component of a time series is more likely to exhibit the relatively steady growth of a variable,such as the population of Egypt from 35 million in 1960 to 75 million in 2005.
(True/False)
4.9/5 (40)
The trend line 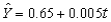 was calculated from quarterly data for 2000 - 2004,where t = 1 for the first quarter of 2000.The trend value for the second quarter of the year 2005 is 0.75.
(True/False)
4.9/5 (46)
Filters
- Essay(0)
- Multiple Choice(0)
- Short Answer(0)
- True False(0)
- Matching(0)