Exam 11: Regression Analysis: Statistical Inference
Exam 1: Introduction to Data Analysis and Decision Making30 Questions
Exam 2: Describing the Distribution of a Single Variable97 Questions
Exam 3: Finding Relationships Among Variables84 Questions
Exam 4: Probability and Probability Distributions113 Questions
Exam 5: Normal, binomial, poisson, and Exponential Distributions118 Questions
Exam 6: Decision Making Under Uncertainty106 Questions
Exam 7: Sampling and Sampling Distributions92 Questions
Exam 8: Confidence Interval Estimation85 Questions
Exam 9: Hypothesis Testing85 Questions
Exam 10: Regression Analysis: Estimating Relationships97 Questions
Exam 11: Regression Analysis: Statistical Inference87 Questions
Exam 12: Time Series Analysis and Forecasting104 Questions
Exam 13: Introduction to Optimization Modeling91 Questions
Exam 14: Optimization Modeling: Applications115 Questions
Exam 15: Introduction to Simulation Modeling81 Questions
Exam 16: Simulation Models104 Questions
Select questions type
Many statistical packages have three types of equation-building procedures.They are:
(Multiple Choice)
4.8/5  (43)
(43)
(A)Estimate the regression model.How well does this model fit the data?
(B)Is there a linear relationship between the explanatory variables and the dependent variable? Explain how you arrived at your answer at the 5% significance level.
(C)Use the estimated regression model to predict the amount of money a customer will spend if their annual salary is $45,000,they have 1 child and they were a customer that purchased merchandise in the previous year (2004).
(D)Find a 95% prediction interval for the point prediction calculated in (C).Use a t-multiple = 2.02.
(E)Find a 95% confidence interval for the amount of money spent by all customers sharing the characteristics described in (C).Use a t-multiple = 2.02.
(F)How do you explain the differences between the widths of the intervals in (D)and (E)?
(Essay)
4.8/5 (39)
Below you will find a scatterplot of data gathered by a mail-order company.The company has been able to obtain the annual salaries of their customers and the amount that each of these customers spent with the company in 1998.Based on the scatterplot below,would you conclude that these data meet all four assumptions of regression? Explain your answer. 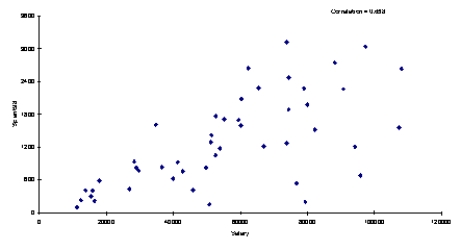
(Essay)
4.7/5 (36)
Multiple regression represents an improvement over simple regression because it allows any number of response variables to be included in the analysis.
(True/False)
4.8/5 (32)
Multicollinearity is a situation in which two or more of the explanatory variables are highly correlated with each other.
(True/False)
4.8/5 (38)
(A)Estimate the regression model.How well does this model fit the given data?
(B)Yes,there is a linear relationship between the number of carpet installations and the number of building permits issued at a = 0.10; The p-value = 0.0866 for the F-statistic.You can conclude that there is a significant linear relationship between these two variables.
(C)The Durbin-Watson statistic for this data was 1.2183.Given this information what would you conclude about the data?
(D)Given your answer in (C),would you recommend modifying the original regression model? If so,how would you modify it?
(Essay)
4.8/5 (43)
When the error variance is nonconstant,it is common to see the variation increases as the explanatory variable increases (you will see a "fan shape" in the scatterplot).There are two ways you can deal with this phenomenon.These are:
(Multiple Choice)
4.8/5 (40)
(A)Estimate a multiple regression model for the data.
(B)Which of the variables in this model have regression coefficients that are statistically different from 0 at the 5% significance level?
(C)Given your findings in (B),which variables,if any,would you choose to remove from the model estimated in (A)? Explain your decision.
(Essay)
4.8/5 (30)
Which of the following definitions best describes parsimony?
(Multiple Choice)
4.8/5 (42)
Which of the following is the relevant sampling distribution for regression coefficients?
(Multiple Choice)
4.9/5 (37)
A researcher can check whether the errors are normally distributed by using:
(Multiple Choice)
4.8/5 (40)
The value k in the number of degrees of freedom,n-k-1,for the sampling distribution of the regression coefficients represents:
(Multiple Choice)
4.7/5 (36)
The objective typically used in the tree types of equation-building procedures are to:
(Multiple Choice)
4.8/5 (32)
If residuals separated by one period are autocorrelated,this is called:
(Multiple Choice)
4.7/5 (41)
The partial F test is a procedure to determine whether extra variables in a group provide any extra explanatory power in the regression equation
(True/False)
4.7/5 (41)
In multiple regression,if there is multicollinearity between independent variables,the t-tests of the individual coefficients may indicate that some variables are not linearly related to the dependent variable,when in fact they are.
(True/False)
4.9/5 (37)
(A)Estimate a simple linear regression model using the sample data.How well does the estimated model fit the sample data?
(B)Perform an F-test for the existence of a linear relationship between Y and X.Use a 5% level of significance.
(C)Plot the fitted values versus residuals associated with the model in (A).What does the plot indicate?
(D)Diagnose what may be causing the problem seen in the residuals plot in (C).What issue(s)do you identify?
(E)Suggest an alternative model to address the issues identified in (D).Are you able to obtain an improved fit to the data? Explain your answer.
(Essay)
4.8/5 (35)
(A)Use the information related to the multiple regression model to determine whether each of the regression coefficients are statistically different from 0 at a 5% significance level.Summarize your findings.
(B)Test at the 5% significance level the relationship between Y and X in each of the simple linear regression models.How does this compare to your answer in (A)? Explain.
(C)Is there evidence of multicollinearity in this situation? Explain why or why not.
(Essay)
4.7/5 (36)
In simple linear regression,if the error variable  is normally distributed,the test statistic for testing
  is t-distributed with n - 2 degrees of freedom.
(True/False)
4.8/5 (35)
When determining whether to include or exclude a variable in regression analysis,if the p-value associated with the variable's t-value is above some accepted significance value,such as 0.05,then the variable:
(Multiple Choice)
4.9/5 (29)
Filters
- Essay(0)
- Multiple Choice(0)
- Short Answer(0)
- True False(0)
- Matching(0)