Exam 11: Regression Analysis: Statistical Inference
Exam 1: Introduction to Data Analysis and Decision Making30 Questions
Exam 2: Describing the Distribution of a Single Variable97 Questions
Exam 3: Finding Relationships Among Variables84 Questions
Exam 4: Probability and Probability Distributions113 Questions
Exam 5: Normal, binomial, poisson, and Exponential Distributions118 Questions
Exam 6: Decision Making Under Uncertainty106 Questions
Exam 7: Sampling and Sampling Distributions92 Questions
Exam 8: Confidence Interval Estimation85 Questions
Exam 9: Hypothesis Testing85 Questions
Exam 10: Regression Analysis: Estimating Relationships97 Questions
Exam 11: Regression Analysis: Statistical Inference87 Questions
Exam 12: Time Series Analysis and Forecasting104 Questions
Exam 13: Introduction to Optimization Modeling91 Questions
Exam 14: Optimization Modeling: Applications115 Questions
Exam 15: Introduction to Simulation Modeling81 Questions
Exam 16: Simulation Models104 Questions
Select questions type
A multiple regression model involves 40 observations and 4 explanatory variables produces SST = 1000 and SSR = 804.The value of MSE is 5.6.
(True/False)
4.8/5  (34)
(34)
(A)Summarize the findings of the stepwise regression method using this cutoff value.
(B)When the cutoff value was increased to 0.10,the output below was the result.The table at top left represents the change when the disposable income variable is added to the model and the table at top right represents the average price variable being added.The regression model with both added variables is shown in the bottom table.Summarize the results for this model.
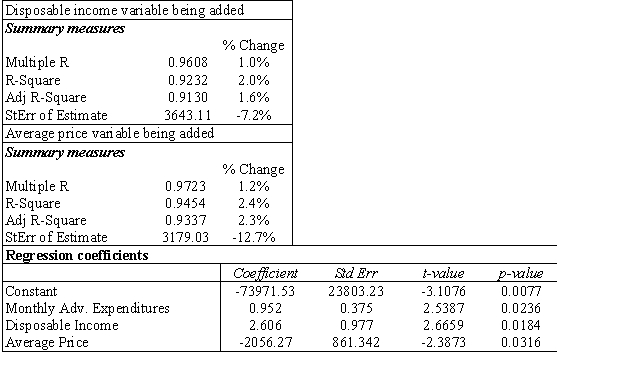 (C)Which model would you recommend using? Why?
(Essay)
4.8/5 (28)
Suppose that one equation has 3 explanatory variables and an F-ratio of 49.Another equation has 5 explanatory variables and an F-ratio of 38.The first equation will always be considered a better model.
(True/False)
4.9/5 (36)
A confidence interval constructed around a point prediction from a regression model is called a prediction interval,because the actual point being estimated is not a population parameter
(True/False)
4.8/5 (43)
Suppose you forecast the values of all of the independent variables and insert them into a multiple regression equation and obtain a point prediction for the dependent variable.You could then use the standard error of the estimate to obtain an approximate
(Multiple Choice)
4.9/5 (30)
The t-value for testing  is calculated using which of the following equations:
(Multiple Choice)
4.8/5 (34)
The ANOVA table splits the total variation into two parts.They are the
(Multiple Choice)
4.8/5 (40)
Which of the following is true regarding regression error,e
(Multiple Choice)
4.8/5 (34)
(A)Estimate the regression model.How well does this model fit the given data?
(B)Is there a linear relationship between the two explanatory variables and the dependent variable at the 5% significance level? Explain how you arrived at your answer.
(C)Use the estimated regression model to predict the annual maintenance expense of a truck that is driven 14,000 miles per year and is 5 years old.
(D)Find a 95% prediction interval for the maintenance expense determined in (C).Use a t-multiple = 2.
(E)Find a 95% confidence interval for the maintenance expense for all trucks sharing the characteristics provided in Question 96.Use a t-multiple = 2.
(F)How do you explain the differences between the widths of the intervals in (D)and (E)?
(Essay)
4.9/5 (24)
In regression analysis,extrapolation is performed when you:
(Multiple Choice)
4.8/5 (30)
Which of the following would be considered a definition of an outlier?
(Multiple Choice)
4.9/5 (39)
In multiple regression with k explanatory variables,the t-tests of the individual coefficients allows us to determine whether  (for i = 1,2,….,k),which tells us whether a linear relationship exists between
  and Y.
(True/False)
4.8/5 (45)
Do you see any problems evident in the plot below of residuals versus fitted values from a multiple regression analysis? Explain your answer. 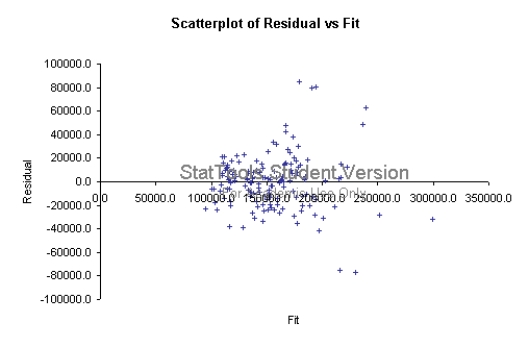
(Essay)
4.8/5 (30)
Suppose you run a regression of a person's height on his/her right and left foot sizes,and you suspect that there may be multicollinearity between the foot sizes.What types of problems might you see if your suspicions are true?
(Multiple Choice)
4.8/5 (31)
If exact multicollinearlity exists,that means that there is redundancy in the data.
(True/False)
4.9/5 (35)
In a multiple regression analysis involving 4 explanatory variables and 40 data points,the degrees of freedom associated with the sum of squared errors,SSE,is 35.
(True/False)
4.8/5 (43)
In a simple linear regression model,testing whether the slope  of the population regression line could be zero is the same as testing whether or not the linear relationship between the response variable Y and the explanatory variable X is significant.
(True/False)
4.8/5 (41)
A scatterplot that exhibits a "fan" shape (the variation of Y increases as X increases)is an example of:
(Multiple Choice)
4.8/5 (31)
(A)Determine the least-squares multiple regression equation.
(B)Interpret the Y- intercept of the regression equation.
(C)Interpret the partial regression coefficients.
(D)What is the estimated number of new visitors to a club if the size of the ad is 6 column-inches and a $100 discount is offered?
(E)Determine the approximate 95% prediction interval for the number of new visitors to a given club when the ad is 5 column-inches and the discount is $80.
(F)What is the value for the percentage of variation explained,and exactly what does it indicate?
(G)At the 0.05 level,is the overall regression equation in (A)significant?
(H)Use the 0.05 level in concluding whether each partial regression coefficient differs significantly from zero.
(I Interpret the results of the preceding tests in (H)and (I)in the context of the two explanatory variables described in the problem.
(J)Construct a 95% confidence interval for each partial regression coefficient in the population regression equation.
(Essay)
4.8/5 (33)
Filters
- Essay(0)
- Multiple Choice(0)
- Short Answer(0)
- True False(0)
- Matching(0)