Exam 3: Finding Relationships Among Variables
Exam 1: Introduction to Data Analysis and Decision Making30 Questions
Exam 2: Describing the Distribution of a Single Variable97 Questions
Exam 3: Finding Relationships Among Variables84 Questions
Exam 4: Probability and Probability Distributions113 Questions
Exam 5: Normal, binomial, poisson, and Exponential Distributions118 Questions
Exam 6: Decision Making Under Uncertainty106 Questions
Exam 7: Sampling and Sampling Distributions92 Questions
Exam 8: Confidence Interval Estimation85 Questions
Exam 9: Hypothesis Testing85 Questions
Exam 10: Regression Analysis: Estimating Relationships97 Questions
Exam 11: Regression Analysis: Statistical Inference87 Questions
Exam 12: Time Series Analysis and Forecasting104 Questions
Exam 13: Introduction to Optimization Modeling91 Questions
Exam 14: Optimization Modeling: Applications115 Questions
Exam 15: Introduction to Simulation Modeling81 Questions
Exam 16: Simulation Models104 Questions
Select questions type
What percentage of the students in the sample went partying the weekend before the final exam and did well in the exam?
(Short Answer)
4.9/5  (37)
(37)
The advantage that the coefficient of correlation has over the covariance is that the former has a set lower and upper limit.
(True/False)
4.8/5 (47)
Which of the following are true statements of pivot tables?
(Multiple Choice)
4.7/5 (37)
The following scatterplot compares the selling price and the appraised value. 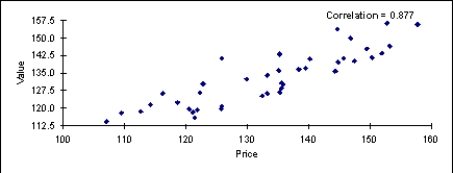 Is there a linear relationship between these two variables? If so,how would you characterize the relationship?
(Essay)
4.8/5 (38)
Correlation and covariance can be used to examine relationships between numerical variables and categorical variables that have been coded numerically.
(True/False)
4.8/5 (42)
The scatterplot is a graphical technique used to describe the relationship between two numerical variables.
(True/False)
4.7/5 (37)
Correlation has the advantage of being in the same original units as the X and Y variables
(True/False)
4.9/5 (36)
We can infer that there is a strong relationship between two numerical variables when
(Multiple Choice)
4.8/5 (35)
Generally speaking,if two variables are unrelated,the covariance will be a positive or negative number close to zero
(True/False)
4.8/5 (29)
What other data would you need to be more confident that increased income inequality leads to lower unemployment?
(Essay)
4.8/5 (40)
Problems in data analysis where we want to compare a numerical variable across two or more subpopulations are called comparison problems.
(True/False)
4.8/5 (35)
Which of the following are considered measures of association?
(Multiple Choice)
4.7/5 (31)
What percentage of the students in the sample went partying the weekend before the final exam and did poorly on the exam?
(Short Answer)
4.9/5 (36)
Approximate the percentage of these internet users who are women in the 30-43 age group.
(Short Answer)
4.7/5 (29)
Filters
- Essay(0)
- Multiple Choice(0)
- Short Answer(0)
- True False(0)
- Matching(0)