Exam 3: Finding Relationships Among Variables
Exam 1: Introduction to Data Analysis and Decision Making30 Questions
Exam 2: Describing the Distribution of a Single Variable97 Questions
Exam 3: Finding Relationships Among Variables84 Questions
Exam 4: Probability and Probability Distributions113 Questions
Exam 5: Normal, binomial, poisson, and Exponential Distributions118 Questions
Exam 6: Decision Making Under Uncertainty106 Questions
Exam 7: Sampling and Sampling Distributions92 Questions
Exam 8: Confidence Interval Estimation85 Questions
Exam 9: Hypothesis Testing85 Questions
Exam 10: Regression Analysis: Estimating Relationships97 Questions
Exam 11: Regression Analysis: Statistical Inference87 Questions
Exam 12: Time Series Analysis and Forecasting104 Questions
Exam 13: Introduction to Optimization Modeling91 Questions
Exam 14: Optimization Modeling: Applications115 Questions
Exam 15: Introduction to Simulation Modeling81 Questions
Exam 16: Simulation Models104 Questions
Select questions type
Of those in the sample who did well in the final exam,what percentage of them spent the weekend before the exam studying?
(Short Answer)
4.7/5  (43)
(43)
It is possible that the data points are close to a curve and have a correlation close to 0,because correlation is relevant only for measuring linear relationships.
(True/False)
5.0/5 (38)
The table shown below contains information technology (IT)investment as a percentage of total investment for eight countries during the 1990s.It also contains the average annual percentage change in employment during the 1990s.Explain how these data shed light on the question of whether IT investment creates or costs jobs.(Hint: Use the data to construct a scatterplot)
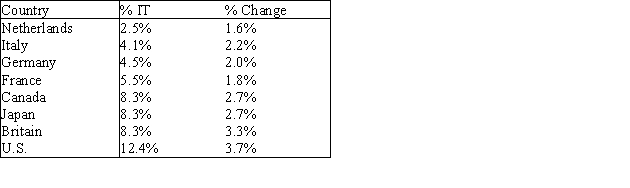
(Essay)
4.8/5 (34)
What percentage of these internet users has formal education beyond high school?
(Short Answer)
4.7/5 (32)
We must specify appropriate bins for side-by-side histograms in order to make fair comparisons of distributions by category.
(True/False)
4.8/5 (44)
A sample of 30 schools produced the pivot table shown below for the average percentage of students graduating from high school.Use this table to determine how the type of school (public or Catholic)that students attend affects their chance of graduating from high school. 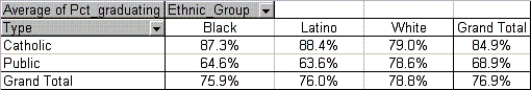
(Essay)
4.8/5 (38)
Approximate the percentage of these Internet users who are single with no formal education beyond high school.
(Short Answer)
4.9/5 (32)
There are two scatterplots shown below.The first chart shows the relationship between the size of the home and the selling price.The second chart examines the relationship between the number of bedrooms in the home and its selling price.Which of these two variables (the size of the home or the number of bedrooms)seems to have the stronger relationship with the home's selling price? Justify your answer. 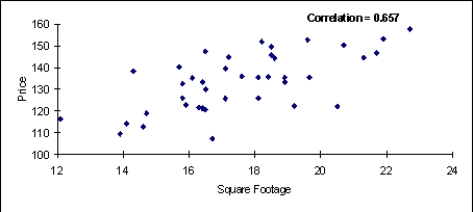
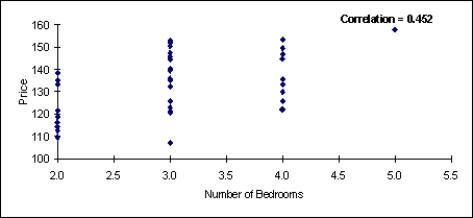
(Essay)
4.9/5 (36)
If the standard deviation of X is 15,the covariance of X and Y is 94.5,the coefficient of correlation r = 0.90,then the variance of Y is 7.0.
(True/False)
4.7/5 (33)
Approximate the percentage of these Internet users who are married with formal education beyond high school.
(Short Answer)
4.7/5 (37)
How would you characterize the relationship between gender and annual salary?
(Essay)
4.9/5 (38)
Of those in the sample who went partying the weekend before the final exam,what percentage of them did well in the exam?
(Short Answer)
4.7/5 (39)
Which of the variables have essentially no linear relationship with the household's average monthly expenditure on utilities?
(Essay)
4.9/5 (38)
If the coefficient of correlation r = 0 .80,the standard deviations of X and Y are 20 and 25,respectively,then Cov(X,Y)must be 400.
(True/False)
4.8/5 (33)
Which of the variables have a positive linear relationship with the household's average monthly expenditure on utilities?
(Essay)
5.0/5 (34)
A useful way of comparing the distribution of a numerical variable across categories of some categorical variable is
(Multiple Choice)
4.9/5 (37)
Tables used to display counts of a categorical variable are called
(Multiple Choice)
4.8/5 (47)
Which two variables have the strongest linear relationship with annual salary?
(Essay)
5.0/5 (32)
The tool that provides useful information about a data set by breaking it down into subpopulations is the:
(Multiple Choice)
4.9/5 (42)
Filters
- Essay(0)
- Multiple Choice(0)
- Short Answer(0)
- True False(0)
- Matching(0)