Exam 16: Streams and Flooding
Exam 1: The Nature of Geology77 Questions
Exam 2: Investigating Geologic Questions61 Questions
Exam 3: Plate Tectonics107 Questions
Exam 4: Earth Materials107 Questions
Exam 5: Igneous Environments103 Questions
Exam 6: Volcanoes and Volcanic Hazards115 Questions
Exam 7: Sedimentary Environments and Rocks103 Questions
Exam 8: Deformation and Metamorphism120 Questions
Exam 9: Geologic Time99 Questions
Exam 10: The Seafloor and Continental Margins90 Questions
Exam 11: Mountains, basins, and Continents91 Questions
Exam 12: Earthquakes and Earths Interior83 Questions
Exam 13: Climate, weather, and Their Influences on Geology85 Questions
Exam 14: Glaciers, shorelines, and Changing Sea Levels102 Questions
Exam 15: Weathering, soil, and Unstable Slopes72 Questions
Exam 16: Streams and Flooding109 Questions
Exam 17: Water Resources129 Questions
Exam 18: Energy and Mineral Resources81 Questions
Exam 19: Geology of the Solar System49 Questions
Select questions type
What is the mostly likely setting for this drainage pattern? 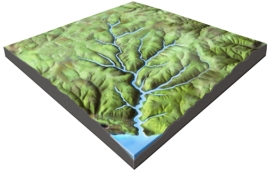
(Multiple Choice)
4.8/5  (35)
(35)
Which of the following statements about streams is NOT true?
(Multiple Choice)
4.9/5 (28)
Which of the features on this aerial photograph represents the former position of a meander? 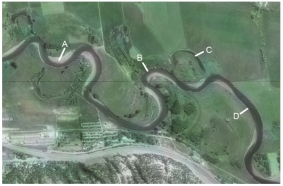
(Multiple Choice)
4.7/5 (31)
This figure shows four numbered river terraces,with 1 being the highest and 4 being the lowest.Which is the oldest terrace? 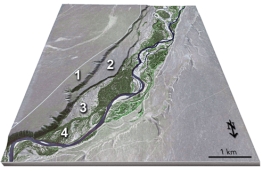
(Multiple Choice)
4.9/5 (32)
Based on the accompanying hydrograph,what was the stream discharge when the data period shown in the graph ended? 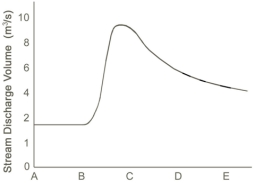
(Multiple Choice)
4.7/5 (34)
Which of the following is NOT associated with many braided streams?
(Multiple Choice)
4.8/5 (34)
On this graph of discharge versus season for a river in the Rocky Mountains,why is the highest runoff likely to be in the spring? 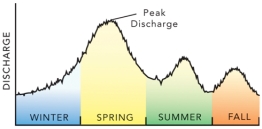
(Multiple Choice)
4.8/5 (28)
In this landscape,choose the location that you think would be best for agricultural fields. 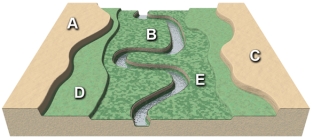
(Multiple Choice)
4.9/5 (35)
Compared with curve 2 on this hydrograph,what is a possible explanation for curve 1? 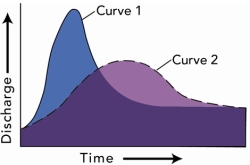
(Multiple Choice)
4.8/5 (27)
If a stream drops 15 meters in 15 kilometers,what is its gradient?
(Multiple Choice)
4.9/5 (37)
In the accompanying hydrograph for major river,a flood was caused by a single episode of heavy rainfall 50 kilometers upstream.When did the rain most likely occur? 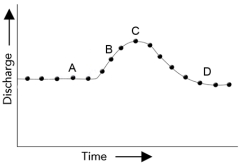
(Multiple Choice)
4.8/5 (41)
Using this plot of annual peak discharge,what is the probability each year that a flood of 1,000 cubic meters per second will occur? 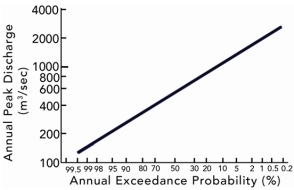
(Multiple Choice)
4.9/5 (35)
The size of clasts that a stream can carry is primarily controlled by:
(Multiple Choice)
4.9/5 (41)
What could cause a canyon to be deeper upstream than downstream? 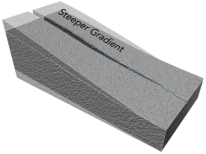
(Multiple Choice)
4.8/5 (40)
Which of the following does NOT influence whether sediment is picked up by a stream?
(Multiple Choice)
4.8/5 (35)
The lowest notch shown on this figure is 9 meters wide and 5 meters high from its base.The river has a velocity of 1 meter per second when it fills the notch.Based on the accompanying graph,what is the probability each year that the notch will be filled to the top? 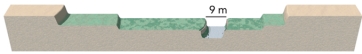
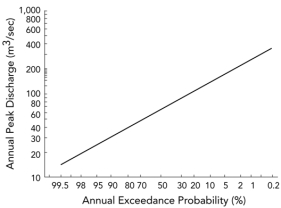
(Multiple Choice)
4.8/5 (39)
Filters
- Essay(0)
- Multiple Choice(0)
- Short Answer(0)
- True False(0)
- Matching(0)