Exam 19: Categorical Outcomes: Chi-Square and Loglinear Analysis
Exam 1: Why Is My Evil Lecturer Forcing Me to Learn Statistics26 Questions
Exam 2: The Spine of Statistics29 Questions
Exam 3: The Phoenix of Statistics16 Questions
Exam 4: The IBM Spss Statistics Environment27 Questions
Exam 5: Exploring Data With Graphs23 Questions
Exam 6: The Beast of Bias32 Questions
Exam 7: Non-Parametric Models21 Questions
Exam 8: Correlation19 Questions
Exam 9: Regression33 Questions
Exam 10: Comparing Two Means20 Questions
Exam 11: Moderation, Mediation and More Regression21 Questions
Exam 12: GlM 1: Comparing Several Independent Means28 Questions
Exam 13: GlM 2: Comparing Means Adjusted for Other Predictors Analysis of Covariance20 Questions
Exam 14: GlM 3: Factorial Designs30 Questions
Exam 15: GlM 4: Repeated-Measures Designs31 Questions
Exam 16: GlM 5: Mixed Designs19 Questions
Exam 17: Multivariate Analysis of Variance Manova20 Questions
Exam 18: Exploratory Factor Analysis19 Questions
Exam 19: Categorical Outcomes: Chi-Square and Loglinear Analysis19 Questions
Exam 20: Categorical Outcomes: Logistic Regression20 Questions
Exam 21: Multilevel Linear Models20 Questions
Select questions type
What are phi and Cramér's V used for?
Free
(Multiple Choice)
4.8/5  (39)
(39)
Correct Answer: Verified
D
Are directional hypotheses possible with chi-square?
Free
(Multiple Choice)
4.8/5 (35)
Correct Answer:Verified
A
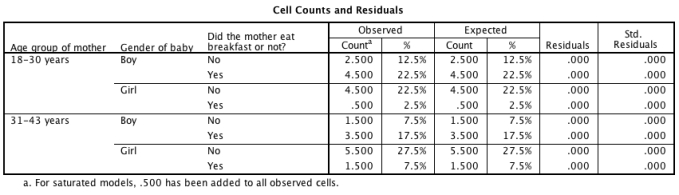
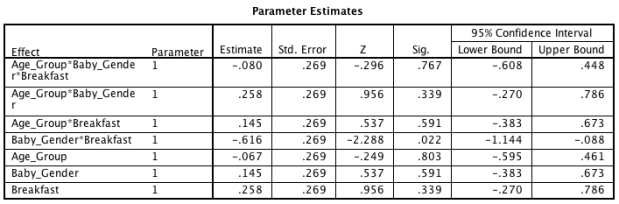
A recent story in the media has claimed that women who eat breakfast every day are more likely to have boy babies than girl babies. Imagine you conducted a study to investigate this in women from two different age groups (18-30 and 31-43 years). Looking at the output tables below, which of the following sentences best describes the results?
 Goodness-of-Fit Tests Chi-Square Sig. Likelihood Ratio .000 0 . Pearson .000 0 .
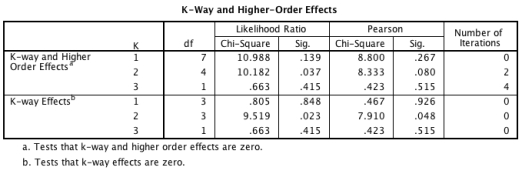
Free
(Multiple Choice)
4.8/5 (33)
Correct Answer:Verified
C
Imagine that you are conducting a one-variable chi-square test to investigate the hypothesis that there are equal numbers of cat lovers and dog lovers in the office at work. Having conducted a survey, you found 150 preferred dogs and 120 preferred cats. What would the expected frequencies be in each cell?
(Multiple Choice)
4.8/5 (32)
How are the degrees of freedom calculated for a chi-square test?
(Multiple Choice)
4.9/5 (27)
A recent story in the media has claimed that women who eat breakfast every day are more likely to have boy babies than girl babies. Imagine you conducted a study to investigate this in women from two different age groups (18-30 and 31-43 years). Looking at the output tables below, which of the following sentences best describes the results?
Goodness-of-Fit Tests Chi-Square Sig. Likelihood Ratio .000 0 . Pearson .000 0 . 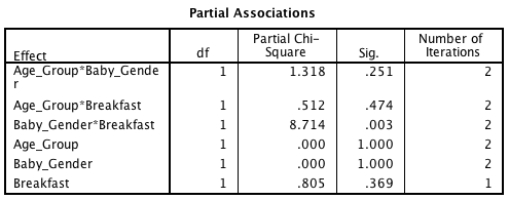
(Multiple Choice)
4.8/5 (32)
With 2 2 contingency tables (i.e., two categorical variables both with two categories) no expected values should be below ____.
(Multiple Choice)
4.8/5 (37)
When conducting a loglinear analysis, if our model is a good fit of the data then the goodness-of-fit statistic for the final model should be:
(Multiple Choice)
4.8/5 (39)
Which of the following statements about the chi-square test is false?
(Multiple Choice)
4.8/5 (25)
A researcher asked 933 people which type of programme they prefer to watch on television. Results are below. News Dexumentaries Soaps Sport Total Women 108 123 187 62 480 Men 130 123 68 132 453 Total 238 246 255 194 933 A chi-square test produced the SPSS output below. What can we conclude from this output?
Value df Asymp. Sig. (2 -sided) Pearson Chi-Square 82.11 3 .000 Likelihood Ratio 84.840 3 .000 Linear-by-Linear .105 1 .746 Association Nof Valid Cases 933
a. 0 cells have expected count less than 5 . The minimum expected count is 94.19 .
(Multiple Choice)
4.9/5 (31)
Men and women were asked which type of animal they thought made the best pets. Data are in the table below. Reptiles Mammals Eirds Men 24 35 20 Wamen 15 47 12 If the expected frequencies rule for chi-square had been violated by the data, which categories could be combined together in a meaningful way to increase the expected frequencies?
(Multiple Choice)
4.9/5 (32)
Which of the hypotheses below would be suited for testing with a one-variable chi-square test?
(Multiple Choice)
4.8/5 (31)
In what way do the assumptions in loglinear analysis differ from those for the chi-square test?
(Multiple Choice)
4.8/5 (36)
Imagine you conducted a study to look at the association between whether an expectant mother eats breakfast (or not) and the gender of her baby. Cramér's V = .22. How would you interpret this value?
(Multiple Choice)
4.9/5 (36)
Which of the following statements about loglinear analysis is false?
(Multiple Choice)
4.9/5 (41)
If the assumption of expected frequencies is not met for a 2 × 2 chi-square test, which of the following remedies could you consider using?
(Multiple Choice)
4.8/5 (31)
Recent research has shown that women who skip breakfast are more likely to give birth to baby girls, whereas women who eat breakfast are more likely to have baby boys. To test this, we took a sample of pregnant women who already knew the gender of their baby and asked them how often they eat breakfast (every day, some days, or never). We want to analyse our data with a chi-square test. How would our analysis be described?
(Multiple Choice)
4.9/5 (40)
Filters
- Essay(0)
- Multiple Choice(0)
- Short Answer(0)
- True False(0)
- Matching(0)