Exam 5: Exploring Data With Graphs
Exam 1: Why Is My Evil Lecturer Forcing Me to Learn Statistics26 Questions
Exam 2: The Spine of Statistics29 Questions
Exam 3: The Phoenix of Statistics16 Questions
Exam 4: The IBM Spss Statistics Environment27 Questions
Exam 5: Exploring Data With Graphs23 Questions
Exam 6: The Beast of Bias32 Questions
Exam 7: Non-Parametric Models21 Questions
Exam 8: Correlation19 Questions
Exam 9: Regression33 Questions
Exam 10: Comparing Two Means20 Questions
Exam 11: Moderation, Mediation and More Regression21 Questions
Exam 12: GlM 1: Comparing Several Independent Means28 Questions
Exam 13: GlM 2: Comparing Means Adjusted for Other Predictors Analysis of Covariance20 Questions
Exam 14: GlM 3: Factorial Designs30 Questions
Exam 15: GlM 4: Repeated-Measures Designs31 Questions
Exam 16: GlM 5: Mixed Designs19 Questions
Exam 17: Multivariate Analysis of Variance Manova20 Questions
Exam 18: Exploratory Factor Analysis19 Questions
Exam 19: Categorical Outcomes: Chi-Square and Loglinear Analysis19 Questions
Exam 20: Categorical Outcomes: Logistic Regression20 Questions
Exam 21: Multilevel Linear Models20 Questions
Select questions type
Based on the chart, what was the median mark (approximately)? 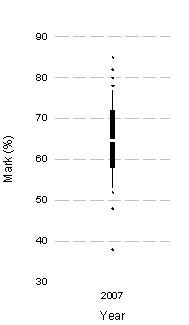
(Multiple Choice)
4.8/5  (32)
(32)
Looking at the graph below, which intervention was the most successful at reducing the number of cigarettes smoked each day in those who did not want to quit? 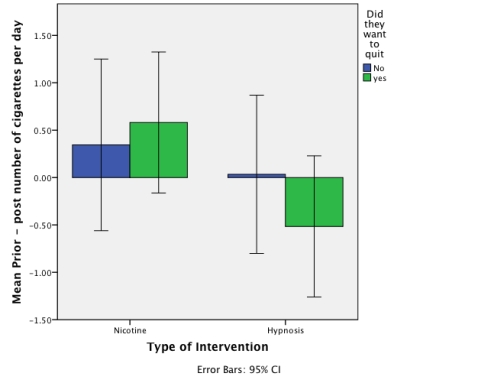
(Multiple Choice)
4.7/5 (32)
Filters
- Essay(0)
- Multiple Choice(0)
- Short Answer(0)
- True False(0)
- Matching(0)