Multiple Choice
Based on the chart, what was the median mark (approximately) ? 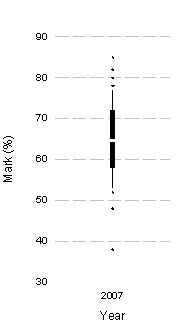
A) 58%
B) 77%
C) 65%
D) 72%
Correct Answer:

Verified
Correct Answer:
Verified
Related Questions
Q13: We took a sample of children who
Q14: What is the graph below known as?
Q15: A study was done to investigate the
Q16: The graph below shows the mean success
Q17: In IBM SPSS, the following graph is
Q18: Looking at the graph below, which of
Q19: Approximately what is the mean success score
Q20: Imagine we took a group of smokers,
Q22: Looking at the graph below, which intervention
Q23: What does a histogram show?<br>A)A histogram is