Exam 7: The Correlation Coefficient
Exam 1: Introduction to Statistics43 Questions
Exam 2: Statistics and the Research Process75 Questions
Exam 3: Frequency Distributions and Percentiles48 Questions
Exam 4: Measures of Central Tendency;the Mean, median, and Mode62 Questions
Exam 5: Measures of Variability: Range, variance, and Standard Deviation59 Questions
Exam 6: Z-Scores and the Normal Curve60 Questions
Exam 7: The Correlation Coefficient52 Questions
Exam 8: Linear Regression52 Questions
Exam 9: Using Probability to Make Decisions About Data56 Questions
Exam 10: Introduction to Hypothesis Testing56 Questions
Exam 11: Performing the One-Sample T-Test and Testing Correlation Coefficients57 Questions
Exam 12: The Two-Sample T-Test65 Questions
Exam 13: The One-Way Analysis of Variance61 Questions
Exam 14: The Two-Way Analysis of Variance56 Questions
Exam 15: Chi Square and Other Nonparametric Procedures49 Questions
Select questions type
What kind of relationship is depicted in the following graph? 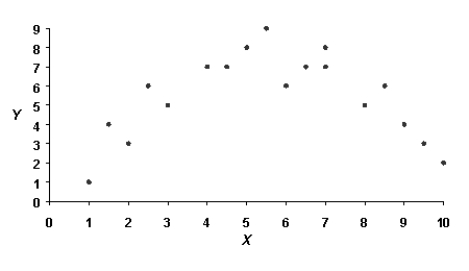
(Multiple Choice)
4.7/5  (35)
(35)
Calculate the appropriate correlation coefficient for the following data. 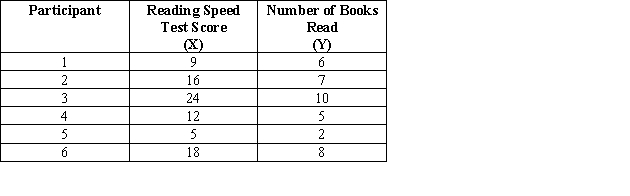
(Multiple Choice)
4.9/5 (37)
Calculate the appropriate correlation coefficient for the following data. 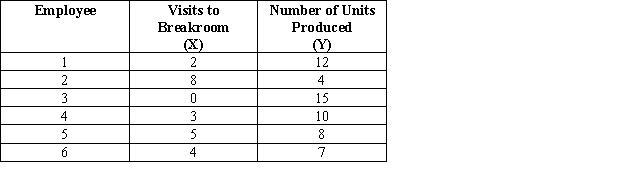
(Multiple Choice)
4.7/5 (27)
In a study about the relationship between their age and women's attitudes about marriage,you survey over 500 undergraduate women and calculate a Pearson correlation coefficient.What mistake have you made?
(Multiple Choice)
4.7/5 (38)
Professor Miller has found that the correlation between a person's "need for affiliation" (found by taking a test to determine the need to be with others)and the number of hours spent watching television is 0.69.He should conclude that
(Multiple Choice)
4.9/5 (44)
Which correlation coefficient should we use if we want to find out whether a relationship exists between two variables that are both interval or ratio variables?
(Multiple Choice)
4.8/5 (38)
Calculate the appropriate correlation coefficient for the following data 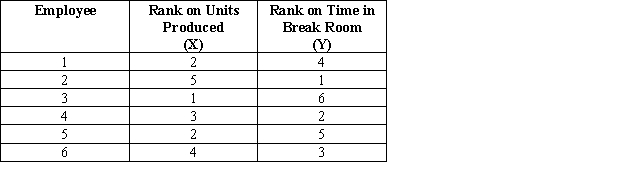
(Multiple Choice)
4.8/5 (50)
What statistic should be used to find out whether there is a relationship between high school class rank and first-semester college GPA rank?
(Multiple Choice)
4.9/5 (35)
What kind of relationship is depicted in the following graph? 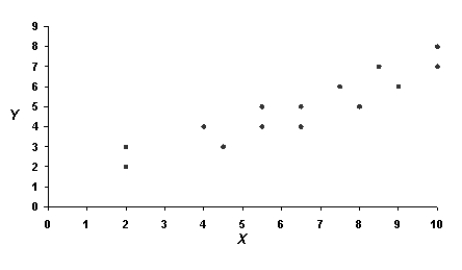
(Multiple Choice)
4.9/5 (40)
What type of relationship does the following regression line represent? 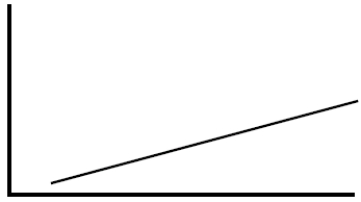
(Multiple Choice)
4.9/5 (29)
When the correlation coefficient representing the relationship between X and Y is intermediate,then all of the following are true except
(Multiple Choice)
4.8/5 (30)
Suppose a researcher has trained two observers to rank participants according to their level of frustration when trying to solve a puzzle.What statistic should be used to determine the extent to which the two observers agree in their rankings of frustration?
(Multiple Choice)
4.9/5 (31)
Which of the following studies represents the weakest relationship? 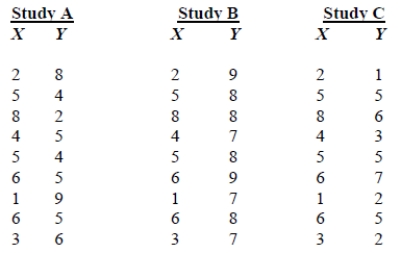
(Multiple Choice)
4.9/5 (44)
"The self-confidence of a group of students is positively correlated with their chances of getting through the course." What does this statement mean?
(Multiple Choice)
4.9/5 (31)
If we compute a correlation on data that come only from the middle of the X distribution (restricted range)rather than from the entire range,the correlation is likely to be _____ the correlation from the entire range.
(Multiple Choice)
4.7/5 (37)
What statistic should be used to find out whether there is a relationship between hours spent participating in sports and GPA?
(Multiple Choice)
4.8/5 (35)
What kind of relationship is depicted in the following graph? 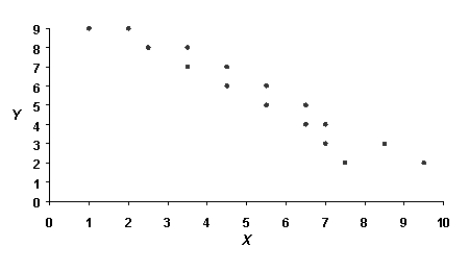
(Multiple Choice)
4.8/5 (43)
Filters
- Essay(0)
- Multiple Choice(0)
- Short Answer(0)
- True False(0)
- Matching(0)