Exam 1: Introduction to Statistics
Exam 1: Introduction to Statistics80 Questions
Exam 2: Summarizing Data: Frequency Distributions in80 Questions
Exam 3: Summarizing Data: Central Tendency80 Questions
Exam 4: Summarizing Data: Variability80 Questions
Exam 5: Probability, Normal Distributions, and Z Scores80 Questions
Exam 6: Characteristics of the Sample Mean79 Questions
Exam 7: Hypothesis Testing: Significance, Effect Size, and Power79 Questions
Exam 8: Testing Means: One-Sample T Test With Confidence Intervals80 Questions
Exam 9: Testing Means: Two- Independent-Sample T Test With Confidence Intervals76 Questions
Exam 10: Testing Means: Related-Samples T Test With Confidence Intervals79 Questions
Exam 11: One-Way Analysis of Variance: Between- Subjects and Within- Subjects Repeated- Measures Designs60 Questions
Exam 12: Two-Way Analysis of Variance: Between-Subjects Factorial Design80 Questions
Exam 13: Correlation and Linear Regression80 Questions
Exam 14: Chi-Square Tests: Goodness of Fit and the Test for Independence78 Questions
Exam 15: Nonparametric Tests for Ordinal Data: Understanding and Interpretation59 Questions
Exam 16: Chi-Square Tests: Goodness-of-Fit and Independence80 Questions
Exam 17: Understanding Regression Analysis80 Questions
Exam 18: Understanding Correlation Coefficients in Statistical Analysis80 Questions
Select questions type
________ are measured along a continuum at any place beyond the decimal point.
(Multiple Choice)
4.7/5  (36)
(36)
Qualitative data varies by ________;quantitative data varies by ________.
(Multiple Choice)
4.8/5 (31)
Only an experiment can demonstrate cause-and-effect relationships between variables.
(True/False)
4.9/5 (25)
A characteristic (usually numeric)that describes a sample is called a
(Multiple Choice)
4.9/5 (43)
Based on the following graphical summary display,what research design was used to record and analyze these data? 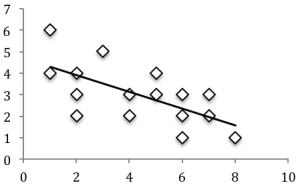
(Multiple Choice)
4.8/5 (38)
________ is the variable that is believed to change in the presence of the independent variable.
(Multiple Choice)
4.8/5 (32)
A social psychologist wants to study the expression of love toward a significant other among American family members.To study this behavior,the psychologist selects a group of local college students and has them complete a love survey.In this example,the group of local college students is the sample.
(True/False)
4.8/5 (35)
Children are randomly assigned to complete a low,moderate,or high difficulty task.The time (in seconds)it takes them to complete the task is recorded.In this example,the level of task difficulty is the dependent variable.
(True/False)
4.8/5 (44)
Recording the number of dreams recalled is an example of ________ data;whereas recording the time (in minutes)spent in a dream stage of sleep is an example of ________ data.
(Multiple Choice)
4.9/5 (33)
In some cases,the number of participants in a sample can be greater than the number of persons in the population from which the same was selected.
(True/False)
4.9/5 (41)
A movie critic rates a movie on a scale from one (lowest)to four (highest)stars.What scale of measurement are the ratings?
(Multiple Choice)
4.8/5 (35)
Inferential statistics is used to determine if observations made in a sample are likely to also be observed in the population from which the sample was selected.
(True/False)
4.9/5 (34)
A researcher records the number of votes for each of five candidates running for class president.Based on her presentation of the following results,what type of statistics did she use? 
(Multiple Choice)
4.9/5 (37)
A researcher records the number of alcoholic drinks consumed per week by students living on campus in rural and urban colleges.In this example,the number of alcoholic drinks consumed per week is the dependent variable.
(True/False)
4.8/5 (38)
Recording whom students study with describes ________ types of data;whereas recording the number of hours spent studying per week describes ________ types of data.
(Multiple Choice)
4.8/5 (38)
Each of the following is an example of quantitative data,except
(Multiple Choice)
4.9/5 (41)
State the four scales of measurement in order from least informative to most informative.
(Multiple Choice)
4.9/5 (36)
A researcher identifies college students as a group of interest to test her hypothesis.She then identifies a few local college students and selects a small group of the local college students to be observed.In this example,the sample is:
(Multiple Choice)
4.8/5 (33)
Filters
- Essay(0)
- Multiple Choice(0)
- Short Answer(0)
- True False(0)
- Matching(0)