Exam 13: Multiple Regression
Exam 1: Overview of Statistics54 Questions
Exam 2: Data Collection113 Questions
Exam 3: Describing Data Visually108 Questions
Exam 4: Descriptive Statistics156 Questions
Exam 5: Probability114 Questions
Exam 6: Discrete Probability Distributions111 Questions
Exam 7: Continuous Probability Distributions114 Questions
Exam 8: Sampling Distributions and Estimation107 Questions
Exam 9: One-Sample Hypothesis Tests135 Questions
Exam 10: Two-Sample Hypothesis Tests116 Questions
Exam 11: Analysis of Variance95 Questions
Exam 12: Simple Regression141 Questions
Exam 13: Multiple Regression133 Questions
Exam 14: Chi-Square Tests95 Questions
Select questions type
If the probability plot of residuals resembles a straight line,the residuals show a fairly good fit to the normal distribution.
Free
(True/False)
4.7/5  (30)
(30)
Correct Answer: Verified
True
Multicollinearity refers to relationships among the independent variables.
Free
(True/False)
4.8/5 (35)
Correct Answer:Verified
True
R2adj can exceed R2 if there are several weak predictors.
Free
(True/False)
4.9/5 (38)
Correct Answer:Verified
False
Plotting the residuals against a binary predictor (X = 0,1)reveals nothing about heteroscedasticity.
(True/False)
4.8/5 (38)
In the fitted regression Y = 12 + 3X1 − 5X2 + 27X3 + 2X4 the most significant predictor is X3.
(True/False)
4.9/5 (39)
A predictor whose pairwise correlation with Y is near zero can still have a significant t-value in a multiple regression when other predictors are included.
(True/False)
4.9/5 (30)
When autocorrelation is present,the estimates of the coefficients will be unbiased.
(True/False)
4.8/5 (30)
To find which predictors are most helpful in increasing R2,we might consider
(Multiple Choice)
4.8/5 (26)
For a given set of values for x1,x2,... ,xk the confidence interval for the conditional mean of Y is
(Multiple Choice)
4.9/5 (30)
In a regression with n = 50 observations and k = 3 predictors,the criterion for high leverage is
(Multiple Choice)
4.9/5 (37)
A realtor is trying to predict the selling price of houses in Greenville (in thousands of dollars)as a function of Size (measured in thousands of square feet)and whether or not there is a fireplace (FP is 0 if there is no fireplace,1 if there is a fireplace).Part of the regression output is provided below,based on a sample of 20 homes.Some of the information has been omitted.  The estimated coefficient for Size is approximately
(Multiple Choice)
4.8/5 (30)
The F statistic and its p-value give a global test of significance for a multiple regression.
(True/False)
4.9/5 (43)
Autocorrelation may be detected by looking at a plot of the residuals against time.
(True/False)
4.9/5 (30)
Nonnormality of residuals is not usually considered a major problem unless there are outliers.
(True/False)
4.9/5 (30)
If the standard error is 12,the width of a quick prediction interval for Y is
(Multiple Choice)
4.9/5 (29)
The regression equation Salary = 28,000 + 2700 YearsExperience + 1900 YearsCollege describes employee salaries at Ramjac Corporation.The standard error is 2400.Mary has 10 years' experience and 4 years of college.Her salary is $58,350.What is Mary's standardized residual (approximately)?
(Multiple Choice)
4.9/5 (38)
Does the picture below show strong evidence of heteroscedasticity against the predictor Wheelbase? 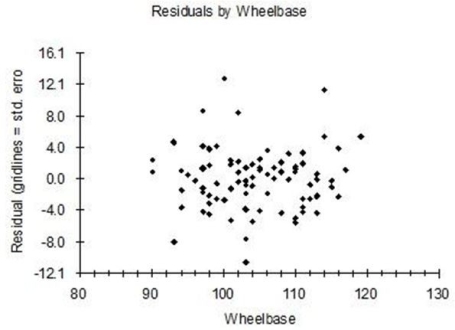
(Multiple Choice)
4.8/5 (29)
Analyze the regression below (n = 50 U.S.states)using the concepts you have learned about multiple regression.Circle things of interest and write comments in the margin.Make a prediction for Poverty for a state with Dropout = 15,TeenMom = 12,Unem = 4,and Age65% = 12 (show your work).The variables are Poverty = percentage below the poverty level;Dropout = percentage of adult population that did not finish high school;TeenMom = percentage of total births by teenage mothers;Unem = unemployment rate,civilian labor force;and Age65% = percentage of population aged 65 and over.


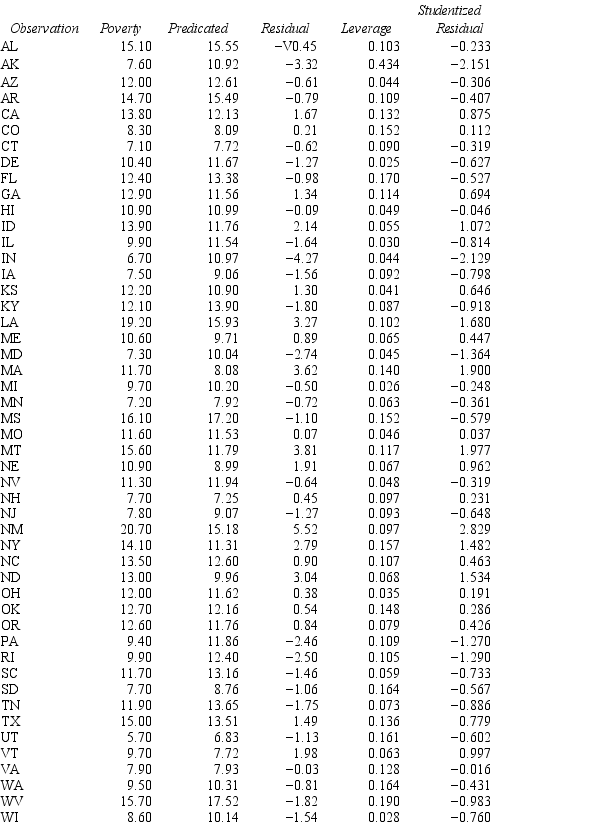
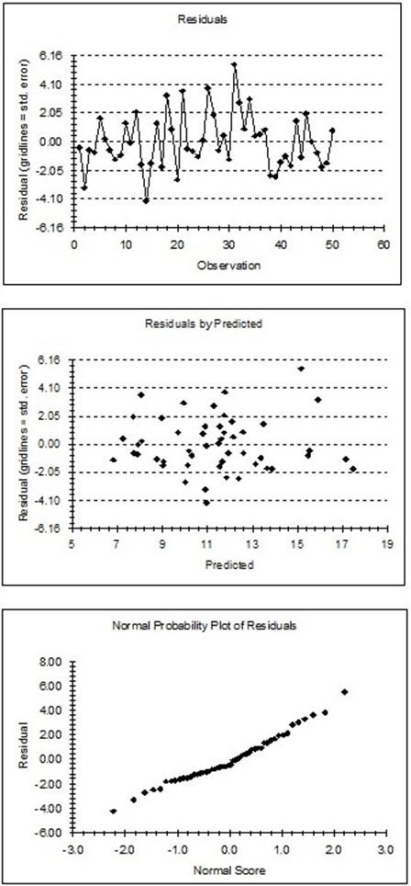
(Essay)
4.8/5 (38)
Filters
- Essay(0)
- Multiple Choice(0)
- Short Answer(0)
- True False(0)
- Matching(0)