Exam 13: Multiple Regression
Exam 1: Overview of Statistics54 Questions
Exam 2: Data Collection113 Questions
Exam 3: Describing Data Visually108 Questions
Exam 4: Descriptive Statistics156 Questions
Exam 5: Probability114 Questions
Exam 6: Discrete Probability Distributions111 Questions
Exam 7: Continuous Probability Distributions114 Questions
Exam 8: Sampling Distributions and Estimation107 Questions
Exam 9: One-Sample Hypothesis Tests135 Questions
Exam 10: Two-Sample Hypothesis Tests116 Questions
Exam 11: Analysis of Variance95 Questions
Exam 12: Simple Regression141 Questions
Exam 13: Multiple Regression133 Questions
Exam 14: Chi-Square Tests95 Questions
Select questions type
Statisticians who work with cross-sectional data generally do not anticipate autocorrelation.
(True/False)
4.9/5  (25)
(25)
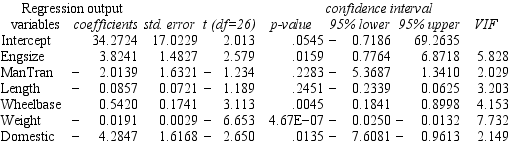
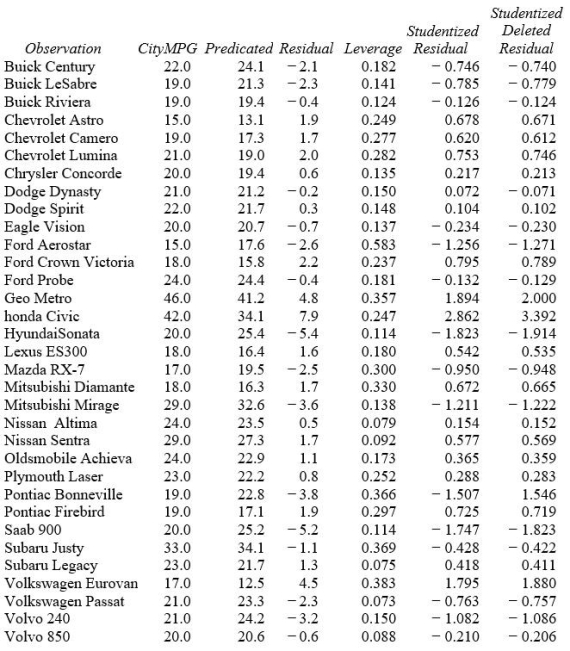
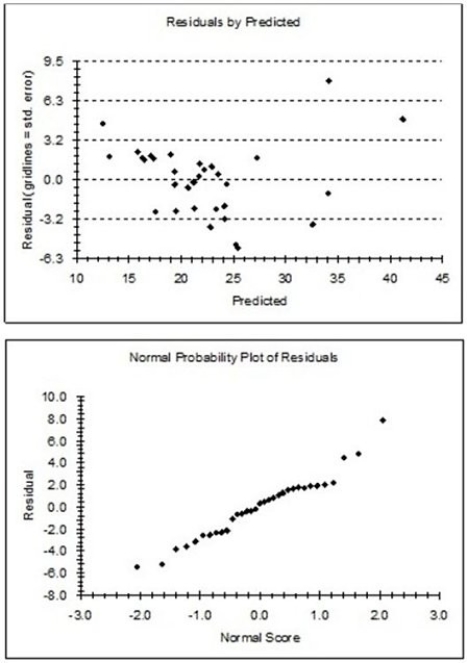
Analyze the regression results below (n = 33 cars in 1993)using the concepts you have learned about multiple regression.Circle things of interest and write comments in the margin.Make a prediction for CityMPG for a car with EngSize = 2.5,ManTran = 1,Length = 184,Wheelbase = 104,Weight = 3000,and Domestic = 0 (show your work).The variables are CityMPG = city MPG (miles per gallon by EPA rating);EngSize = engine size (liters);ManTran = 1 if manual transmission available,0 otherwise;Length = vehicle length (inches);Wheelbase = vehicle wheelbase (inches);Weight = vehicle weight (pounds);Domestic = 1 if U.S.manufacturer,0 otherwise.


(Essay)
4.8/5 (38)
A fitted multiple regression equation is Y = 28 + 5X1 - 4X2 + 7X3 + 2X4.When X1 increases 2 units and X2 increases 2 units as well,while X3 and X4 remain unchanged,what change would you expect in your estimate of Y?
(Multiple Choice)
4.9/5 (32)
An observation with extreme values in one or more independent variables (predictors)
(Multiple Choice)
4.8/5 (41)
A realtor is trying to predict the selling price of houses in Greenville (in thousands of dollars)as a function of Size (measured in thousands of square feet)and whether or not there is a fireplace (FP is 0 if there is no fireplace,1 if there is a fireplace).Part of the regression output is provided below,based on a sample of 20 homes.Some of the information has been omitted.  Which statement is supported by the regression output?
(Multiple Choice)
4.9/5 (32)
The regression equation Salary = 35,000 + 3500 YearsExperience + 1200 YearsCollege describes employee salaries at Streeling Research Labs.The standard error is 2500.Doris has 20 years' experience and 4 years of college.Her salary is $113,000.What is Doris's standardized residual?
(Multiple Choice)
5.0/5 (30)
Using state data (n = 50)for the year 2000,a statistics student calculated a matrix of correlation coefficients for selected variables describing state averages on the two main scholastic aptitude tests (ACT and SAT).(a)In the spaces provided,write the two-tailed critical values of the correlation coefficient for α = .05 and α = .01 respectively.Show how you derived these critical values.(b)Mark with * all correlations that are significant at α = .05,and mark with ** those that are significant at α = .01.(c)Why might you expect a negative correlation between ACT% and SAT%? (d)Why might you expect a positive correlation between SATQ and SATV? Explain your reasoning.(e)Why is the matrix empty above the diagonal?


(Essay)
4.8/5 (30)
Autocorrelation of the residuals may affect the reliability of the t-values for the estimated coefficients of the predictors X1,X2,... ,Xk.
(True/False)
4.8/5 (37)
If you rerun a regression,omitting a predictor X5,which would be unlikely?
(Multiple Choice)
4.8/5 (44)
Refer to this ANOVA table from a regression:  Which statement is not accurate?
(Multiple Choice)
4.8/5 (34)
In a multiple regression with five predictors in a sample of 56 U.S.cities,we would use F5,50 in a test of overall significance.
(True/False)
4.7/5 (26)
Which is not a standard criterion for assessing a regression model?
(Multiple Choice)
4.7/5 (39)
Multicollinearity can be detected from t tests of the predictor variables.
(True/False)
4.8/5 (40)
In a multiple regression with 3 predictors in a sample of 25 U.S.cities,we would use F3,21 in a test of overall significance.
(True/False)
4.9/5 (40)
In a regression with n = 100 observations and k = 5 predictors,the criterion for high leverage is
(Multiple Choice)
4.9/5 (32)
Heteroscedasticity of residuals in regression suggests that there is
(Multiple Choice)
4.8/5 (27)
Which multiple regression equation contains an interaction term?
(Multiple Choice)
4.9/5 (38)
A disadvantage of Excel's regression is that it does not give as much accuracy in the estimated regression coefficients as a package like Minitab.
(True/False)
4.7/5 (31)
A test is conducted in 22 cities to see if giving away free transit system maps will increase the number of bus riders.In a regression analysis,the dependent variable Y is the increase in bus riders (in thousands of persons)from the start of the test until its conclusion.The independent variables are X1 = the number (in thousands)of free maps distributed and a binary variable X2 = 1 if the city has free downtown parking,0 otherwise.The estimated regression equation is Y = 1.32 + 0.0345X1 − 1.45X2.In city 3,the observed Y value is 7.3,X1 = 140,and X2 = 0.The residual for city 3 (in thousands)is
(Multiple Choice)
4.8/5 (36)
Filters
- Essay(0)
- Multiple Choice(0)
- Short Answer(0)
- True False(0)
- Matching(0)