Exam 19: Aggregate Supply and Aggregate Demand
Exam 1: Getting Started347 Questions
Exam 2: The Usand Global Economies211 Questions
Exam 3: The Economic Problem282 Questions
Exam 4: Demand and Supply334 Questions
Exam 5: Elasticities of Demand and Supply342 Questions
Exam 6: Efficiency and Fairness of Markets361 Questions
Exam 7: Government Actions in Markets335 Questions
Exam 8: Global Markets in Action281 Questions
Exam 9: Externalities: Pollution, education, and Health Care297 Questions
Exam 10: Production and Cost274 Questions
Exam 11: Perfect Competition285 Questions
Exam 12: Monopoly384 Questions
Exam 13: Monopolistic Competition and Oligopoly313 Questions
Exam 14: Gdp: a Measure of Total Production and Income263 Questions
Exam 15: Jobs and Unemployment293 Questions
Exam 16: The Cpi and the Cost of Living273 Questions
Exam 17: Potential Gdp and Economic Growth330 Questions
Exam 18: Money and the Monetary System370 Questions
Exam 19: Aggregate Supply and Aggregate Demand313 Questions
Exam 20: Fiscal Policy and Monetary Policy222 Questions
Select questions type
An increase in government expenditure on goods and services ________ aggregate demand,shifting the aggregate demand curve ________ and potentially bringing the ________ phase of the business cycle.
(Multiple Choice)
4.8/5  (40)
(40)
If real GDP is less than potential GDP,then the ________ and the price level ________.
(Multiple Choice)
4.7/5 (37)
A fall in the price level brings a ________ in the real wage rate that ________ profits which leads to ________.
(Multiple Choice)
4.9/5 (40)
Which of the following does NOT shift the aggregate demand curve?
(Multiple Choice)
4.8/5 (24)
Stagflation is defined as a period when real GDP ________ and the price level ________.
(Multiple Choice)
4.8/5 (37)
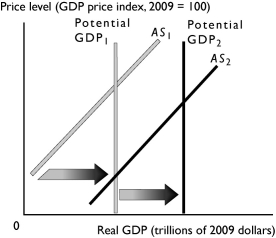 -The change in potential real GDP and aggregate supply shown in the graph above can be a result of
(Multiple Choice)
4.9/5 (45)
Which of the following changes aggregate supply and shifts the aggregate supply curve?
I.change in the price level
Ii.change in potential GDP
Iii.change in the money wage rate
(Multiple Choice)
4.9/5 (40)
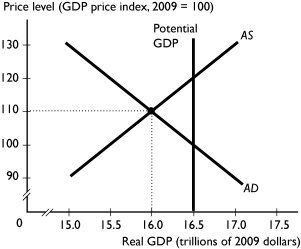 -In the figure above,the economy is at an equilibrium with real GDP of $16 trillion and a price level of 110.As the economy moves toward its ultimate equilibrium,the ________ curve shifts ________.
(Multiple Choice)
4.9/5 (45)
 The figure above shows aggregate demand curves.
-Based on the figure above,the aggregate demand curve will shift from AD0 to AD2 when
The figure above shows aggregate demand curves.
-Based on the figure above,the aggregate demand curve will shift from AD0 to AD2 when
(Multiple Choice)
4.8/5 (25)
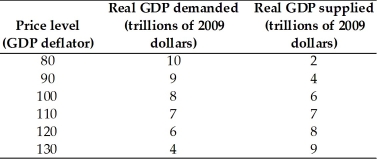 The table gives the aggregate demand and aggregate supply schedules for a nation.
-Based on the table above,the equilibrium price level is
The table gives the aggregate demand and aggregate supply schedules for a nation.
-Based on the table above,the equilibrium price level is
(Multiple Choice)
4.7/5 (33)
Along the aggregate supply curve,the quantity of real GDP supplied increases when the price level rises because
(Multiple Choice)
4.9/5 (29)
An economy experiences a recessionary gap.As the economy adjusts to full employment,the money wage rate
(Multiple Choice)
4.9/5 (37)
What are the two channels through which the world economy can affect U.S.aggregate demand? State what changes in the world economy can increase U.S.aggregate demand.
(Essay)
4.9/5 (34)
How does a cut in interest rates that increases investment affect the quantity of real GDP demanded,the aggregate demand curve,real GDP,and the price level?
(Essay)
4.9/5 (33)
Filters
- Essay(0)
- Multiple Choice(0)
- Short Answer(0)
- True False(0)
- Matching(0)