Exam 4: Demand and Supply
Exam 1: Getting Started347 Questions
Exam 2: The Usand Global Economies211 Questions
Exam 3: The Economic Problem282 Questions
Exam 4: Demand and Supply334 Questions
Exam 5: Elasticities of Demand and Supply342 Questions
Exam 6: Efficiency and Fairness of Markets361 Questions
Exam 7: Government Actions in Markets335 Questions
Exam 8: Global Markets in Action281 Questions
Exam 9: Externalities: Pollution, education, and Health Care297 Questions
Exam 10: Production and Cost274 Questions
Exam 11: Perfect Competition285 Questions
Exam 12: Monopoly384 Questions
Exam 13: Monopolistic Competition and Oligopoly313 Questions
Exam 14: Gdp: a Measure of Total Production and Income263 Questions
Exam 15: Jobs and Unemployment293 Questions
Exam 16: The Cpi and the Cost of Living273 Questions
Exam 17: Potential Gdp and Economic Growth330 Questions
Exam 18: Money and the Monetary System370 Questions
Exam 19: Aggregate Supply and Aggregate Demand313 Questions
Exam 20: Fiscal Policy and Monetary Policy222 Questions
Select questions type
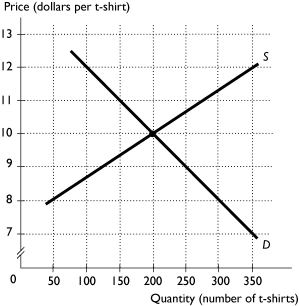 -The above figure shows the market for game day t-shirts.If the price of t-shirts is $8,then
(Multiple Choice)
4.9/5  (39)
(39)
Teenagers drink more soda than other age groups.If the number of teenagers increases,everything else remaining the same,
(Multiple Choice)
4.8/5 (33)
Milk can be used to produce cheese or butter.If the price of a pound of butter rises,what happens to the supply of cheese?
(Multiple Choice)
4.9/5 (35)
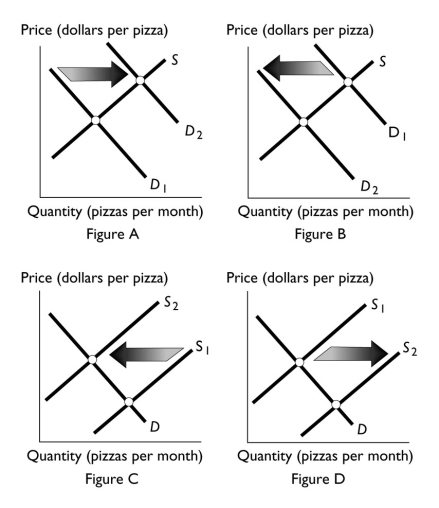 -Which figure above shows the effect if research is published claiming that eating pizza is healthy?
(Multiple Choice)
4.9/5 (27)
Suppose that the equilibrium price and quantity of new houses both increase.Which of the following could be a cause of this change?
(Multiple Choice)
5.0/5 (36)
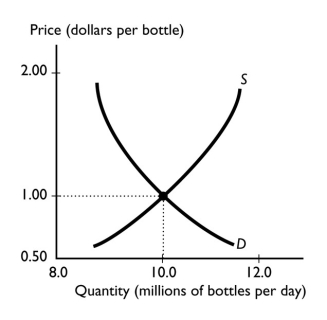 -The graph illustrates the market for bottled water.If the producers of bottled water switch to using improved technology,then the
(Multiple Choice)
4.8/5 (25)
Suppose Ramen noodles,an inexpensive but a quite tasty dish,are an inferior good.Why do grocery stores in college towns,that is,towns with a large fraction of college students,stock a lot of Ramen noodles?
(Essay)
4.9/5 (41)
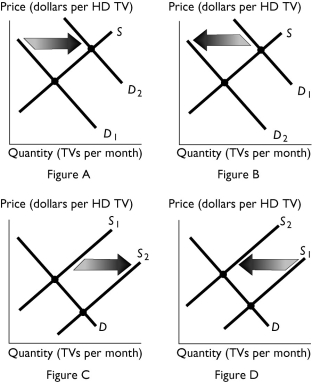 -The above figures show the market for HD televisions.If research is published showing that watching HD television shows causes eye damage,then which figure shows the effect of this change?
(Multiple Choice)
4.8/5 (38)
Which of the following results in an increase in the supply of a good or service?
(Multiple Choice)
4.7/5 (30)
Which of the following shifts the supply curve of rutabagas rightward? (A rutabaga is a potato-like vegetable. )
(Multiple Choice)
4.8/5 (37)
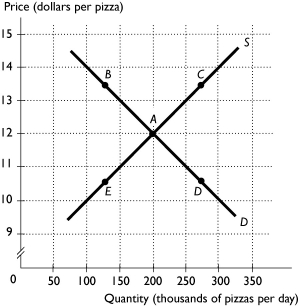 -The above figure shows the market for pizza.The market is in equilibrium when the cheese used to produce pizza falls in price.What point represents the most likely new price and quantity?
(Multiple Choice)
4.8/5 (34)
-The above figures show the market for HD televisions.If more firms start to produce HD televisions ,which figure shows the effect of this change?
(Multiple Choice)
4.9/5 (38)
An increase in the equilibrium price and a decrease in the equilibrium quantity can be the result of
(Multiple Choice)
4.8/5 (34)
The demand for cat food decreases while the supply increases.The equilibrium price of cat food ________,and the equilibrium quantity ________.
(Multiple Choice)
4.9/5 (36)
Filters
- Essay(0)
- Multiple Choice(0)
- Short Answer(0)
- True False(0)
- Matching(0)