Exam 4: Demand and Supply
Exam 1: Getting Started347 Questions
Exam 2: The Usand Global Economies211 Questions
Exam 3: The Economic Problem282 Questions
Exam 4: Demand and Supply334 Questions
Exam 5: Elasticities of Demand and Supply342 Questions
Exam 6: Efficiency and Fairness of Markets361 Questions
Exam 7: Government Actions in Markets335 Questions
Exam 8: Global Markets in Action281 Questions
Exam 9: Externalities: Pollution, education, and Health Care297 Questions
Exam 10: Production and Cost274 Questions
Exam 11: Perfect Competition285 Questions
Exam 12: Monopoly384 Questions
Exam 13: Monopolistic Competition and Oligopoly313 Questions
Exam 14: Gdp: a Measure of Total Production and Income263 Questions
Exam 15: Jobs and Unemployment293 Questions
Exam 16: The Cpi and the Cost of Living273 Questions
Exam 17: Potential Gdp and Economic Growth330 Questions
Exam 18: Money and the Monetary System370 Questions
Exam 19: Aggregate Supply and Aggregate Demand313 Questions
Exam 20: Fiscal Policy and Monetary Policy222 Questions
Select questions type
Suppose that the productivity used to produce computers advances.How does this change affect the supply of computers and the supply curve of computers?
(Essay)
4.9/5  (46)
(46)
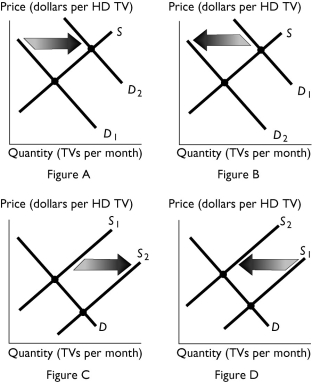 -The above figures show the market for HD televisions.If people's incomes increase and HD televisions are a normal good,which figure shows the effect of this change?
(Multiple Choice)
4.8/5 (40)
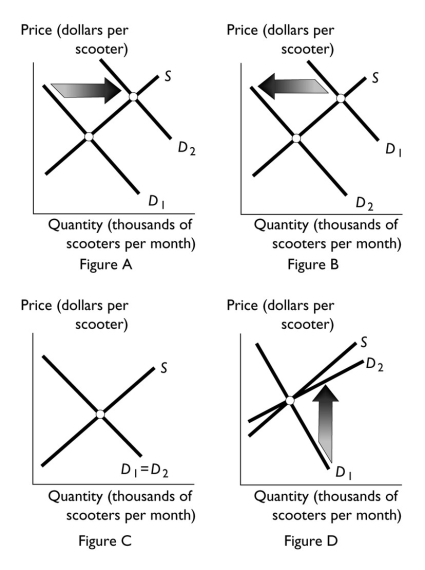 -Scooters are a normal good and buyers' incomes decrease.Which of the figures above best illustrates how this change affects the demand curve for scooters?
(Multiple Choice)
4.9/5 (30)
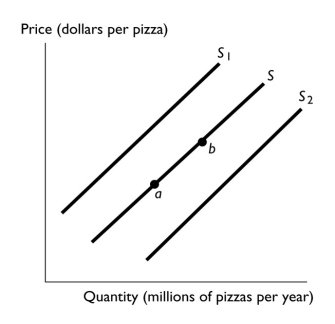 -In the above figure,the shift in the supply curve from S to S1 reflects
(Multiple Choice)
4.8/5 (35)
If the demand for digital cameras increases when consumers' incomes rise,then digital cameras are
(Multiple Choice)
4.7/5 (32)
Fresh orange juice and frozen orange juice are substitutes in production.The price of fresh orange juice rises.As a result,the equilibrium price of frozen orange juice ________,and the equilibrium quantity ________.
(Multiple Choice)
4.9/5 (41)
The "quantity demanded" of any good or service is ________ during a specified time period and at a specified price.
(Multiple Choice)
4.7/5 (33)
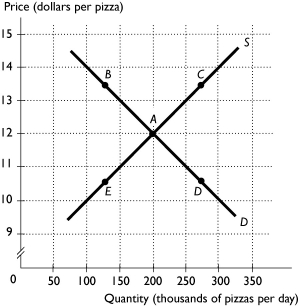 -The above figure shows the market for pizza.The market is in equilibrium when people learn that eating pizza helps prevent heart disease.What point represents the most likely new price and quantity?
(Multiple Choice)
4.8/5 (34)
In the above figure,________ will shift in the demand curve from D to D1.
(Multiple Choice)
4.8/5 (34)
If a higher price for wheat decreases the quantity of corn being produced,which of the following describes what has occurred?
(Multiple Choice)
4.8/5 (37)
Smart phones are becoming less expensive as new technology reduces the cost of production.In a supply and demand model,explain the effects of the technological innovations and their effect on the quantity of smart phones.
(Essay)
4.9/5 (35)
-In the above figure,the shift in the supply curve from S to S2 might reflect
(Multiple Choice)
4.8/5 (34)
Which of the following definitely results in a product's equilibrium price rising?
(Multiple Choice)
4.8/5 (33)
Soft drinks and milk are substitutes for consumers.Draw a graph showing the effect of an increase in the price of milk on the demand for soft drinks.
(Essay)
4.9/5 (32)
Suppose improvements in technology cause the supply of natural gas to increase and at the same time the demand for natural gas increases.What are we sure of?
(Multiple Choice)
4.8/5 (43)
If the demand for a good increases when people's incomes increase,
(Multiple Choice)
4.9/5 (35)
Filters
- Essay(0)
- Multiple Choice(0)
- Short Answer(0)
- True False(0)
- Matching(0)