Exam 4: Demand and Supply
Exam 1: Getting Started347 Questions
Exam 2: The Usand Global Economies211 Questions
Exam 3: The Economic Problem282 Questions
Exam 4: Demand and Supply334 Questions
Exam 5: Elasticities of Demand and Supply342 Questions
Exam 6: Efficiency and Fairness of Markets361 Questions
Exam 7: Government Actions in Markets335 Questions
Exam 8: Global Markets in Action281 Questions
Exam 9: Externalities: Pollution, education, and Health Care297 Questions
Exam 10: Production and Cost274 Questions
Exam 11: Perfect Competition285 Questions
Exam 12: Monopoly384 Questions
Exam 13: Monopolistic Competition and Oligopoly313 Questions
Exam 14: Gdp: a Measure of Total Production and Income263 Questions
Exam 15: Jobs and Unemployment293 Questions
Exam 16: The Cpi and the Cost of Living273 Questions
Exam 17: Potential Gdp and Economic Growth330 Questions
Exam 18: Money and the Monetary System370 Questions
Exam 19: Aggregate Supply and Aggregate Demand313 Questions
Exam 20: Fiscal Policy and Monetary Policy222 Questions
Select questions type
Consider the market for peanut butter.If there is a decrease in the price of deli turkey slices (a substitute in consumption for peanut butter)along with a decrease in the price of peanut brittle (a substitute in production for peanut butter),the
(Multiple Choice)
4.8/5  (43)
(43)
"Other things remaining the same,if the price of a good rises,the quantity supplied of that good increases." This sentence describes a
(Multiple Choice)
4.9/5 (34)
A change in the price of a good ________ its supply curve and ________ a movement along its supply curve.
(Multiple Choice)
4.8/5 (45)
List the factors that change supply and shift the supply curve.Tell what happens to supply and the supply curve when there is an increase in the factor.
(Essay)
4.7/5 (31)
 -In the above figure,an increase in cost of the cheese used to produce pizza
(Multiple Choice)
4.9/5 (39)
When personal computers were first produced,the price was very high.As time passed,the price of personal computers fell because
(Multiple Choice)
4.9/5 (27)
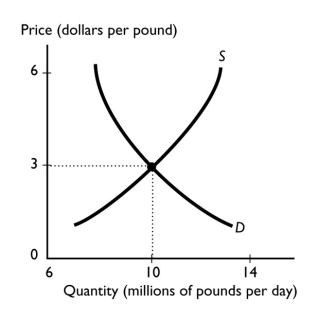
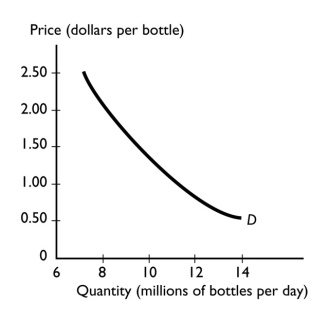 -According to the figure above,which of the following events will increase the quantity demanded of bottled water?
(Multiple Choice)
4.9/5 (43)
Candy makers accurately anticipate the increase in demand for candy for Halloween so that the supply of candy and demand for candy increase the same amount.As a result,the price of candy ________ and the quantity of candy ________.
(Multiple Choice)
4.8/5 (32)
Suppose the equilibrium quantity of movie tickets is 1000.If the demand curve shifts ________,the equilibrium quantity of movie tickets will ________.
(Multiple Choice)
4.8/5 (38)
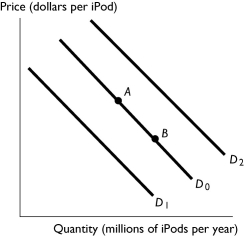 -The figure above shows the market for iPods.Which of the following shifts the demand curve from D0 to D1?
(Multiple Choice)
4.8/5 (39)
What leads to a decrease in the quantity demanded of a good or service?
(Essay)
4.8/5 (36)
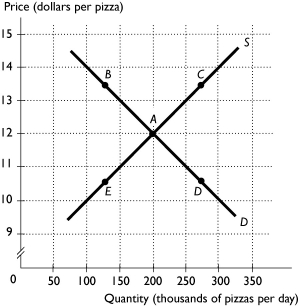 -The above figure shows the market for pizza.The market is in equilibrium when the wages paid pizza workers increases.What point represents the most likely new price and quantity?
(Multiple Choice)
4.7/5 (40)
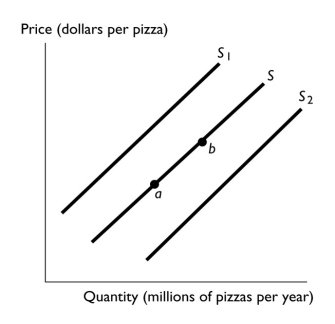
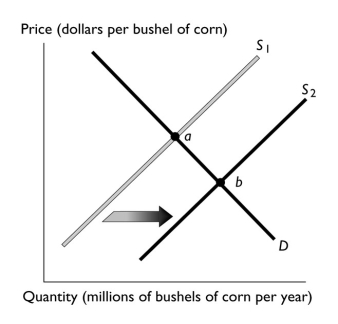 -The above figure illustrates the market for corn.If point "a" represents the original equilibrium and point "b" the new equilibrium,which of the following could have caused the change?
(Multiple Choice)
4.7/5 (37)
If the number of companies producing memory chips increases,then the
(Multiple Choice)
4.9/5 (39)
Consumers eat salsa with taco chips.The price of salsa rises.How does the increase in the price of salsa affect the demand for taco chips?
(Multiple Choice)
4.8/5 (36)
Suppose that tattoos gained immense popularity with retired people as well as college students.This gain in popularity best reflects which of the following influences on buying plans?
(Multiple Choice)
4.9/5 (39)
Two brands of water,Natural Water and Mountain Water,are close substitutes.If the price of Mountain Water decreases,the fall in price
(Multiple Choice)
4.9/5 (28)
Which of the following results in a movement upward along the demand curve for movies?
(Multiple Choice)
4.8/5 (36)
 -The graph illustrates the market for British pounds,the currency of the United Kingdom.As the number of buyers of pounds increases and the number of sellers of pounds increases,the equilibrium price of a pound
(Multiple Choice)
4.9/5 (39)
Filters
- Essay(0)
- Multiple Choice(0)
- Short Answer(0)
- True False(0)
- Matching(0)