Exam 8: Aggregate Expenditure and Equilibrium Output
Exam 1: The Scope and Method of Economics120 Questions
Exam 2: The Economic Problem: Scarcity and Choice110 Questions
Exam 3: Demand,supply,and Market Equilibrium144 Questions
Exam 4: Demand and Supply Applications86 Questions
Exam 5: Introduction to Macroeconomics121 Questions
Exam 6: Measuring National Output and National Income146 Questions
Exam 7: Unemployment, inflation, and Long-Run Growth149 Questions
Exam 8: Aggregate Expenditure and Equilibrium Output176 Questions
Exam 9: The Government and Fiscal Policy179 Questions
Exam 10: The Money Supply and the Federal Reserve System144 Questions
Exam 11: Money Demand and the Equilibrium Interest Rate129 Questions
Exam 12: The Determination of Aggregate Output, the Price Level, and the Interest Rate119 Questions
Exam 13: Policy Effects and Costs Shocks in the Asad Model102 Questions
Exam 14: The Labor Market in the Macroeconomy147 Questions
Exam 15: Financial Crises, stabilization, and Deficits129 Questions
Exam 16: Household and Firm Behavior in the Macroeconomy: a Further Look185 Questions
Exam 17: Long-Run Growth93 Questions
Exam 18: Alternative Views in Macroeconomics147 Questions
Exam 19: International Trade,comparative Advantage,and Protectionism151 Questions
Exam 20: Open-Economy Macroeconomics: the Balance of Payments and Exchange Rates160 Questions
Exam 21: Economic Growth in Developing and Transitional Economies105 Questions
Select questions type
Refer to the information provided in Figure 8.1 below to answer the questions that follow. 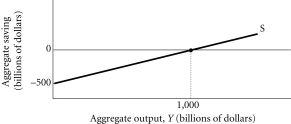 Figure 8.1
-Refer to Figure 8.1.This household's consumption function is
Figure 8.1
-Refer to Figure 8.1.This household's consumption function is
(Multiple Choice)
4.8/5  (33)
(33)
Refer to the information provided in Table 8.4 below to answer the questions that follow.
Table 8.4 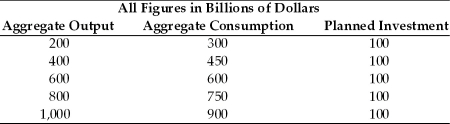 -Refer to Table 8.4.Planned investment equals actual investment at
(Multiple Choice)
4.9/5 (40)
Refer to the information provided in Figure 8.2 below to answer the questions that follow. 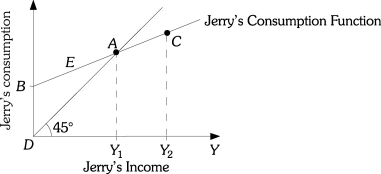 Figure 8.2
-Refer to Figure 8.2.Along the line segment AC,Jerry's
Figure 8.2
-Refer to Figure 8.2.Along the line segment AC,Jerry's
(Multiple Choice)
4.8/5 (42)
If unplanned business investment is $20 million and planned investment is $20 million,then actual investment is
(Multiple Choice)
4.8/5 (43)
Refer to the information provided in Figure 8.11 below to answer the questions that follow. 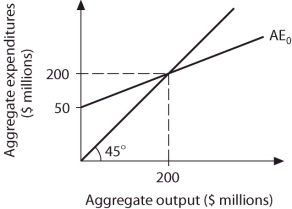 Figure 8.11
-Refer to Figure 8.11.A $10 million increase in investment changes equilibrium output to
Figure 8.11
-Refer to Figure 8.11.A $10 million increase in investment changes equilibrium output to
(Multiple Choice)
4.7/5 (38)
Refer to the information provided in Figure 8.1 below to answer the questions that follow. Figure 8.1
-Refer to Figure 8.1.The MPS for this household is ________ and the MPC is ________.
(Multiple Choice)
4.9/5 (33)
In 2012 Happyland's planned investment was $90 billion and its actual investment was $140 billion.In 2012 Happyland's unplanned inventory change was
(Multiple Choice)
4.8/5 (37)
Refer to the information provided in Figure 8.1 below to answer the questions that follow. Figure 8.1
-Refer to Figure 8.1.The equation for this household's saving function is
(Multiple Choice)
4.9/5 (41)
Refer to the information provided in Figure 8.1 below to answer the questions that follow. Figure 8.1
-Refer to Figure 8.1.At income level $1,500,this household's saving is ________ than (to)zero and this household's consumption is ________ zero.
(Multiple Choice)
4.8/5 (33)
Refer to the information provided in Table 8.4 below to answer the questions that follow.
Table 8.4
-Refer to Table 8.4.If aggregate output equals ________,there will be a $100 billion unplanned decrease in inventories.
(Multiple Choice)
4.9/5 (35)
If consumption is $30,000 when income is $35,000,and consumption increases to $36,000 when income increases to $43,000,the MPC is
(Multiple Choice)
4.8/5 (33)
Assume there is no government or foreign sector.If the MPS is 0.2,a $40 billion decrease in planned investment will cause aggregate output to decrease by
(Multiple Choice)
4.9/5 (40)
Refer to the information provided in Figure 8.9 below to answer the questions that follow. 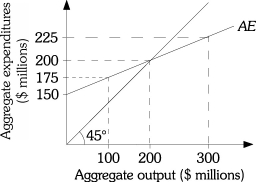 Figure 8.9
-Refer to Figure 8.9.At aggregate output level $100 million,there is a
Figure 8.9
-Refer to Figure 8.9.At aggregate output level $100 million,there is a
(Multiple Choice)
4.9/5 (43)
Refer to the information provided in Figure 8.1 below to answer the questions that follow. Figure 8.1
-Refer to Figure 8.1.An increase in the MPC
(Multiple Choice)
4.8/5 (38)
Refer to the information provided in Figure 8.5 below to answer the questions that follow. 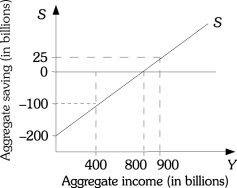 Figure 8.5
-Refer to Figure 8.5.If aggregate income is $400 billion,aggregate saving is ________ billion.
Figure 8.5
-Refer to Figure 8.5.If aggregate income is $400 billion,aggregate saving is ________ billion.
(Multiple Choice)
4.8/5 (44)
Filters
- Essay(0)
- Multiple Choice(0)
- Short Answer(0)
- True False(0)
- Matching(0)