Exam 5: Elasticities of Demand and Supply
Exam 1: Getting Started347 Questions
Exam 2: The U.S.and Global Economies211 Questions
Exam 3: The Economic Problem283 Questions
Exam 4: Demand and Supply334 Questions
Exam 5: Elasticities of Demand and Supply342 Questions
Exam 6: Efficiency and Fairness of Markets364 Questions
Exam 7: Government Actions in Markets248 Questions
Exam 8: Taxes270 Questions
Exam 9: Global Markets in Action281 Questions
Exam 10: Externalities301 Questions
Exam 11: Public Goods and Common Resources180 Questions
Exam 12: Markets with Private Information103 Questions
Exam 13: Consumer Choice and Demand295 Questions
Exam 14: Production and Cost274 Questions
Exam 15: Perfect Competition285 Questions
Exam 16: Monopoly384 Questions
Exam 17: Monopolistic Competition221 Questions
Exam 18: Oligopoly228 Questions
Exam 19: Markets for Factors of Production188 Questions
Exam 20: Economic Inequality164 Questions
Select questions type
Suppose the University of Oklahoma increases the price of student football tickets for the 2012 season by 30 percent.If the price elasticity of demand for student tickets is 1.22,the price increase leads to
(Multiple Choice)
4.9/5  (32)
(32)
The price elasticity of demand for Red Delicious apples,a certain type of apple,is likely
(Multiple Choice)
4.7/5 (30)
If a 10 percent increase in income leads to a 5 percent decrease in the demand for a good,the income elasticity of demand equals ________ and the good is ________ good.
(Multiple Choice)
4.9/5 (30)
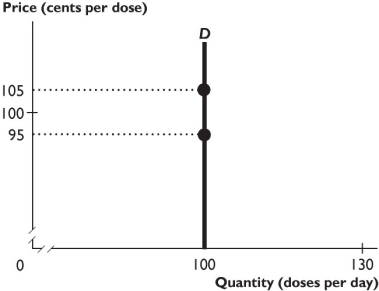 -The demand curve shown in the figure above reflects demand that is
(Multiple Choice)
4.8/5 (32)
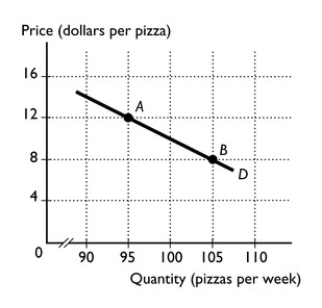 -The figure above shows the demand curve for pizza.Using the midpoint method and moving from point A to point B,calculate the
a.percentage change in price.
b.percentage change in quantity demanded.
c.price elasticity of demand.
-The figure above shows the demand curve for pizza.Using the midpoint method and moving from point A to point B,calculate the
a.percentage change in price.
b.percentage change in quantity demanded.
c.price elasticity of demand.
(Essay)
4.7/5 (27)
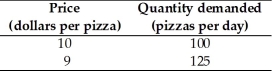 -The data in the table above give two points on the demand curve for pizza.Using the midpoint method,when the price of a pizza falls from $10 to $9,what is the percentage change in price?
(Multiple Choice)
4.8/5 (36)
The total revenue test says that if a price decrease leads to
(Multiple Choice)
4.8/5 (33)
When income increases from $20,000 to $30,000 the quantity of inter-city bus trips taken per year decreases from 10 to 8.Hence
(Multiple Choice)
4.8/5 (28)
 -A firm raises the price it charges.The firm's total revenue decreases.What can we conclude about the price elasticity of demand?
(Multiple Choice)
4.8/5 (44)
The cross elasticity of demand for strawberry jelly and grape jelly is likely to be
(Multiple Choice)
4.9/5 (32)
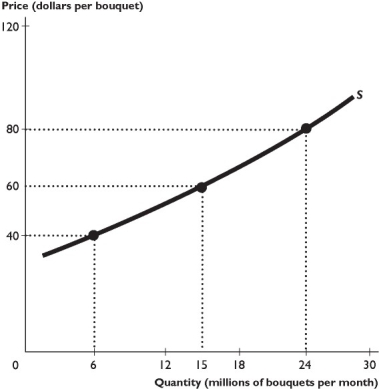 The figure above shows the supply curve for roses.
-In the figure above,at the point where the price is $60 per bunch,the price elasticity of supply is
The figure above shows the supply curve for roses.
-In the figure above,at the point where the price is $60 per bunch,the price elasticity of supply is
(Multiple Choice)
4.9/5 (30)
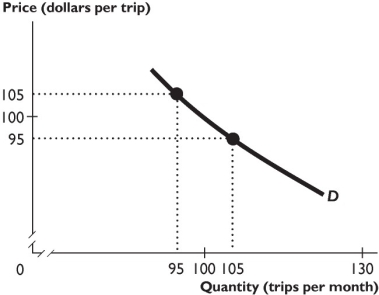 -The demand curve shown in the figure above is ________ over the price range from $95 to $105 per trip.
(Multiple Choice)
4.8/5 (37)
For which of the following would the supply likely be most inelastic?
(Multiple Choice)
4.9/5 (35)
Demand for a product tends to be more elastic the longer the time period considered because
(Multiple Choice)
4.7/5 (36)
After long hair for men became popular,barbers found that their incomes fell.In an attempt to boost their incomes,many barbers raised the price of a haircut and yet their total revenue fell even more.What can explain this result?
(Multiple Choice)
4.8/5 (40)
The price elasticity of supply is a measure of the extent to which the quantity supplied of a good changes when the
(Multiple Choice)
4.8/5 (41)
Filters
- Essay(0)
- Multiple Choice(0)
- Short Answer(0)
- True False(0)
- Matching(0)