Exam 5: Elasticities of Demand and Supply
Exam 1: Getting Started347 Questions
Exam 2: The U.S.and Global Economies211 Questions
Exam 3: The Economic Problem283 Questions
Exam 4: Demand and Supply334 Questions
Exam 5: Elasticities of Demand and Supply342 Questions
Exam 6: Efficiency and Fairness of Markets364 Questions
Exam 7: Government Actions in Markets248 Questions
Exam 8: Taxes270 Questions
Exam 9: Global Markets in Action281 Questions
Exam 10: Externalities301 Questions
Exam 11: Public Goods and Common Resources180 Questions
Exam 12: Markets with Private Information103 Questions
Exam 13: Consumer Choice and Demand295 Questions
Exam 14: Production and Cost274 Questions
Exam 15: Perfect Competition285 Questions
Exam 16: Monopoly384 Questions
Exam 17: Monopolistic Competition221 Questions
Exam 18: Oligopoly228 Questions
Exam 19: Markets for Factors of Production188 Questions
Exam 20: Economic Inequality164 Questions
Select questions type
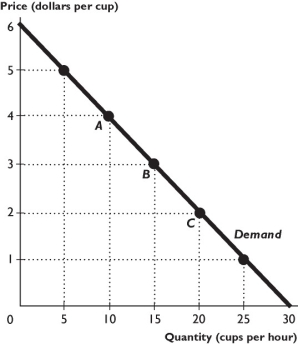 The figure above shows the demand curve for Starbucks latte.
-In the figure above,the demand is unit elastic
The figure above shows the demand curve for Starbucks latte.
-In the figure above,the demand is unit elastic
(Multiple Choice)
5.0/5  (37)
(37)
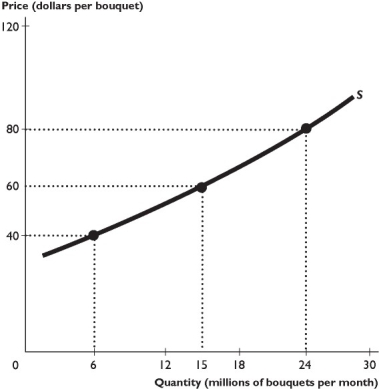 The figure above shows the supply curve for roses.
-Suppose an increase in supply lowers the price from $10 to $8 and increases the quantity demanded from 100 units to 130 units.Using the midpoint method,the elasticity of demand equals
The figure above shows the supply curve for roses.
-Suppose an increase in supply lowers the price from $10 to $8 and increases the quantity demanded from 100 units to 130 units.Using the midpoint method,the elasticity of demand equals
(Multiple Choice)
4.8/5 (35)
Is supply more elastic or less elastic as more time passes after a price change? Explain your answer.
(Essay)
4.9/5 (29)
"The price elasticity of demand is a measure of how sensitive demanders are to changes in the price of a product." Is this statement true or false?
(Essay)
4.8/5 (40)
If a 1 percent increase in the price of X increases the quantity demanded of Y by 2 percent,then X and Y are
(Multiple Choice)
4.9/5 (36)
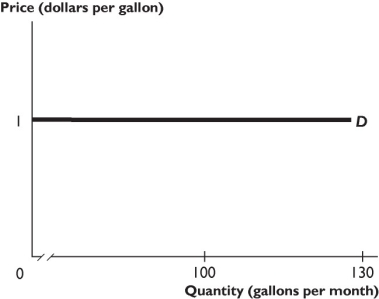 -The demand curve shown in the figure above reflects demand that is
(Multiple Choice)
4.9/5 (46)
If a good has many close substitutes,then its demand is most likely
(Multiple Choice)
4.9/5 (40)
When income increases from $20,000 to $30,000 the number of home delivered pizzas per year increases from 22 to 40.The income elasticity of demand for home delivered pizza equals
(Multiple Choice)
4.7/5 (41)
"If the price falls and,as a result,the total revenue decreases,demand is elastic." Is the previous assertion correct?
(Essay)
4.7/5 (34)
If we ignore the negative or positive sign,the midpoint method of calculating a percentage change in price between two points on a demand curve results in
(Multiple Choice)
4.8/5 (27)
The figure above shows the supply curve for roses.
-In the figure above,at the point where the price is $50 per bunch,the price elasticity of supply is
(Multiple Choice)
4.8/5 (35)
Many manufactured goods have an ________ supply if production plans have only a short period to change and as time passes and all production adjustments are made,the supply of the good ________ from the initial response.
(Multiple Choice)
4.8/5 (30)
If demand is ________,a price cut ________ the total revenue.
(Multiple Choice)
4.8/5 (39)
The demand for oil is inelastic.So,does an increase in the price of oil mean an increase in total revenue or a decrease in total revenue for oil producers?
(Essay)
4.8/5 (34)
When the percentage change in the quantity supplied equals the percentage change in price,the supply is
(Multiple Choice)
4.9/5 (36)
Along a linear (straight-line)downward-sloping demand curve,demand is unit elastic at
(Multiple Choice)
4.9/5 (37)
The figure above shows the demand curve for Starbucks latte.
-In the figure above,the demand is inelastic in the range of prices between
(Multiple Choice)
4.9/5 (44)
Filters
- Essay(0)
- Multiple Choice(0)
- Short Answer(0)
- True False(0)
- Matching(0)