Exam 1: Getting Started
Exam 1: Getting Started347 Questions
Exam 2: The U.S.and Global Economies211 Questions
Exam 3: The Economic Problem283 Questions
Exam 4: Demand and Supply334 Questions
Exam 5: Elasticities of Demand and Supply342 Questions
Exam 6: Efficiency and Fairness of Markets364 Questions
Exam 7: Government Actions in Markets248 Questions
Exam 8: Taxes270 Questions
Exam 9: Global Markets in Action281 Questions
Exam 10: Externalities301 Questions
Exam 11: Public Goods and Common Resources180 Questions
Exam 12: Markets with Private Information103 Questions
Exam 13: Consumer Choice and Demand295 Questions
Exam 14: Production and Cost274 Questions
Exam 15: Perfect Competition285 Questions
Exam 16: Monopoly384 Questions
Exam 17: Monopolistic Competition221 Questions
Exam 18: Oligopoly228 Questions
Exam 19: Markets for Factors of Production188 Questions
Exam 20: Economic Inequality164 Questions
Select questions type
"The change in the value of the variable measured on the y-axis divided by the change in the value of the variable measured on the x-axis" is the definition of
Free
(Multiple Choice)
4.8/5  (37)
(37)
Correct Answer: Verified
B
Scarcity results from the fact that
Free
(Multiple Choice)
4.8/5 (38)
Correct Answer:Verified
A
A graph of the value of one variable against the value of another variable is known as a
Free
(Multiple Choice)
4.9/5 (32)
Correct Answer:Verified
D
Because human wants are insatiable and unlimited while available resources are limited,people are said to face the problem of
(Multiple Choice)
4.9/5 (44)
When a third string NFL quarterback earns more than a police officer,society answers the ________ question.
(Multiple Choice)
4.9/5 (40)
To show the values of an economic variable for different groups in a population at a point in time,it is best to use a
(Multiple Choice)
4.9/5 (35)
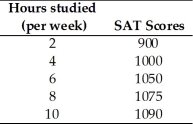 -Jamie is preparing to take his SAT tests.The table above shows how Jamie's score depends on the number of hours a week Jamie studies
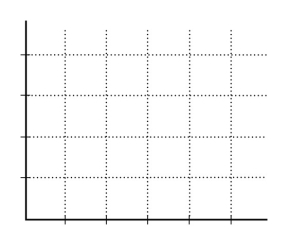
a.Plot the relationship in the figure,putting the hours studied on the horizontal axis.
-Jamie is preparing to take his SAT tests.The table above shows how Jamie's score depends on the number of hours a week Jamie studies
a.Plot the relationship in the figure,putting the hours studied on the horizontal axis.
 b.Is the relationship you plotted positive or negative?
c.What happens to the slope of the relationship as hours studied increase?
d.Suppose Jamie can enroll in an SAT prep course and,by so doing,for every possible number of hours he studies,his score will be 100 points higher.Plot the new relationship between the number of hours studied and Jamie's SAT score in the figure.
e.How many variables are involved in the figure you just completed?
b.Is the relationship you plotted positive or negative?
c.What happens to the slope of the relationship as hours studied increase?
d.Suppose Jamie can enroll in an SAT prep course and,by so doing,for every possible number of hours he studies,his score will be 100 points higher.Plot the new relationship between the number of hours studied and Jamie's SAT score in the figure.
e.How many variables are involved in the figure you just completed?
(Essay)
4.9/5 (39)
Explain whether the statement,"Hillary Clinton was elected President of the United States in 2008," is a normative or positive statement.
(Essay)
5.0/5 (31)
Instead of studying for an additional two hours for the economics final,Leann decides to watch a movie.Leann is making
(Multiple Choice)
4.7/5 (37)
Whenever people's incomes increase,they buy more guitars.Hence a scatter diagram shows that the relationship between income and guitars purchased is
(Multiple Choice)
5.0/5 (39)
Congress and the President passed a national health care policy.This is an example of
(Multiple Choice)
4.8/5 (30)
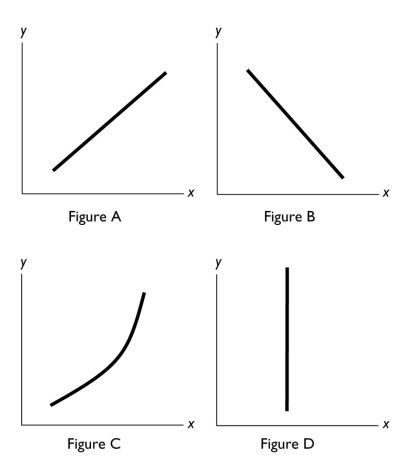 -In the diagram above,which figure(s)show(s)a direct relationship between the variables?
(Multiple Choice)
4.9/5 (27)
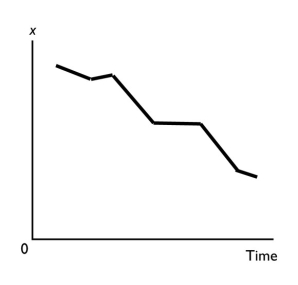 -A graph showing the values of an economic variable for different groups in a population at a point in time is called a
(Multiple Choice)
4.8/5 (26)
Choices that are best for the individuals that make them are choices in pursuit of
(Multiple Choice)
4.8/5 (36)
Filters
- Essay(0)
- Multiple Choice(0)
- Short Answer(0)
- True False(0)
- Matching(0)