Exam 12: Policy Effects and Cost Shocks in the Asad Model
Exam 1: The Scope and Method of Economics238 Questions
Exam 2: The Economic Problem: Scarcity and Choice220 Questions
Exam 3: Demand, Supply, and Market Equilibrium298 Questions
Exam 4: Demand and Supply Applications173 Questions
Exam 5: Introduction to Macroeconomics241 Questions
Exam 6: Measuring National Output and National Income292 Questions
Exam 7: Unemployment, Inflation, and Long-Run Growth297 Questions
Exam 8: Aggregate Expenditure and Equilibrium Output355 Questions
Exam 9: The Government and Fiscal Policy362 Questions
Exam 10: Money, the Federal Reserve, and the Interest Rate358 Questions
Exam 11: The Determination of Aggregate Output, the Price Level, and the Interest Rate243 Questions
Exam 12: Policy Effects and Cost Shocks in the Asad Model200 Questions
Exam 13: The Labor Market in the Macroeconomy287 Questions
Exam 14: Financial Crises, Stabilization, and Deficits260 Questions
Exam 15: Household and Firm Behavior in the Macroeconomy: a Further Look364 Questions
Exam 16: Long-Run Growth196 Questions
Exam 17: Alternative Views in Macroeconomics294 Questions
Exam 18: International Trade, Comparative Advantage, and Protectionism301 Questions
Exam 19: Open-Economy Macroeconomics: the Balance of Payments and Exchange Rates308 Questions
Exam 20: Economic Growth in Developing Economies133 Questions
Exam 21: Critical Thinking About Research105 Questions
Select questions type
If the economy is on the steep part of its aggregate supply curve, expansionary policy will mostly increase the price level.
(True/False)
5.0/5  (41)
(41)
With a cost shock, a large decrease in output relative to the increase in the price level would occur if the ________ curve is relatively ________.
(Multiple Choice)
4.9/5 (38)
The Fed will raise the interest rate by the greatest amount when the economy is on the ________ part of the AS curve and there is ________.
(Multiple Choice)
4.8/5 (43)
Refer to the information provided in Figure 12.2 below to answer the questions that follow. 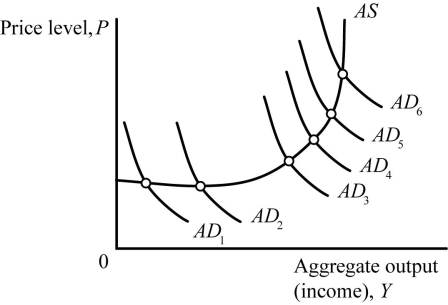 Figure 12.2
-Refer to Figure 12.2. Planned investment would experience the least amount of crowding out when the aggregate demand curve shifts from
Figure 12.2
-Refer to Figure 12.2. Planned investment would experience the least amount of crowding out when the aggregate demand curve shifts from
(Multiple Choice)
4.9/5 (38)
Since 1970, the United States has experienced 5 ________ periods and 2 ________ periods.
(Multiple Choice)
4.9/5 (44)
When analyzing the effects of government spending, net taxes, and the Z factors, what primarily matters is the shape of
(Multiple Choice)
4.8/5 (41)
Refer to the information provided in Figure 12.1 below to answer the questions that follow. 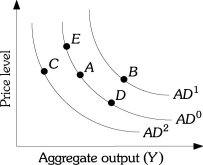 Figure 12.1
-Refer to Figure 12.1. Suppose the economy is at Point A, a decrease in the price level can cause a movement to Point
Figure 12.1
-Refer to Figure 12.1. Suppose the economy is at Point A, a decrease in the price level can cause a movement to Point
(Multiple Choice)
4.7/5 (36)
The Fed generally had high interest rates ________ as it fought inflation.
(Multiple Choice)
4.8/5 (38)
12.3 Shocks to the System
Refer to the information provided in Figure 12.3 below to answer the questions that follow. 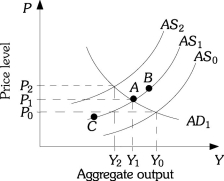 Figure 12.3
-Refer to Figure 12.3. Assume the economy is currently at Point A on aggregate supply curve AS1. An increase in inflationary expectations that causes firms to increase their prices
Figure 12.3
-Refer to Figure 12.3. Assume the economy is currently at Point A on aggregate supply curve AS1. An increase in inflationary expectations that causes firms to increase their prices
(Multiple Choice)
4.9/5 (40)
Fiscal policy affects the ________ market through changes in taxes and government spending.
(Multiple Choice)
4.8/5 (31)
Refer to the information provided in Figure 12.1 below to answer the questions that follow. Figure 12.1
-Refer to Figure 12.1. Suppose the economy is at Point A a(n) ________ can cause a movement to Point C.
(Multiple Choice)
4.8/5 (41)
A decrease in inflationary expectations that causes firms to decrease their prices shifts the
(Multiple Choice)
4.8/5 (38)
A decrease in net taxes will result in consumption crowding out planned investment when the economy is on the steep part of the AS curve.
(True/False)
4.8/5 (30)
Refer to the information provided in Figure 12.1 below to answer the questions that follow. Figure 12.1
-Refer to Figure 12.1. An aggregate demand shift from AD2 to AD0 can be caused by
(Multiple Choice)
4.9/5 (35)
Refer to the information provided in Figure 12.1 below to answer the questions that follow. Figure 12.1
-Refer to Figure 12.1. An aggregate demand shift from AD1 to AD2 can be caused by
(Multiple Choice)
4.9/5 (35)
Filters
- Essay(0)
- Multiple Choice(0)
- Short Answer(0)
- True False(0)
- Matching(0)