Exam 8: Aggregate Expenditure and Equilibrium Output
Exam 1: The Scope and Method of Economics238 Questions
Exam 2: The Economic Problem: Scarcity and Choice220 Questions
Exam 3: Demand, Supply, and Market Equilibrium298 Questions
Exam 4: Demand and Supply Applications173 Questions
Exam 5: Introduction to Macroeconomics241 Questions
Exam 6: Measuring National Output and National Income292 Questions
Exam 7: Unemployment, Inflation, and Long-Run Growth297 Questions
Exam 8: Aggregate Expenditure and Equilibrium Output355 Questions
Exam 9: The Government and Fiscal Policy362 Questions
Exam 10: Money, the Federal Reserve, and the Interest Rate358 Questions
Exam 11: The Determination of Aggregate Output, the Price Level, and the Interest Rate243 Questions
Exam 12: Policy Effects and Cost Shocks in the Asad Model200 Questions
Exam 13: The Labor Market in the Macroeconomy287 Questions
Exam 14: Financial Crises, Stabilization, and Deficits260 Questions
Exam 15: Household and Firm Behavior in the Macroeconomy: a Further Look364 Questions
Exam 16: Long-Run Growth196 Questions
Exam 17: Alternative Views in Macroeconomics294 Questions
Exam 18: International Trade, Comparative Advantage, and Protectionism301 Questions
Exam 19: Open-Economy Macroeconomics: the Balance of Payments and Exchange Rates308 Questions
Exam 20: Economic Growth in Developing Economies133 Questions
Exam 21: Critical Thinking About Research105 Questions
Select questions type
Refer to the information provided in Figure 8.11 below to answer the questions that follow. 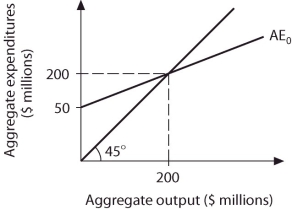 Figure 8.11
-Refer to Figure 8.11. A $20 million decrease in autonomous consumption
Figure 8.11
-Refer to Figure 8.11. A $20 million decrease in autonomous consumption
(Multiple Choice)
4.9/5  (31)
(31)
The marginal propensity to consume is the change in consumption per change in income.
(True/False)
4.7/5 (33)
If autonomous consumption decreases, the size of the multiplier would
(Multiple Choice)
4.8/5 (30)
Refer to the information provided in Figure 8.11 below to answer the questions that follow. Figure 8.11
-Refer to Figure 8.11. A $10 million decrease in autonomous consumption
(Multiple Choice)
4.7/5 (36)
Suppose consumption is $7,500 when income is $4,000 and the MPS equals 0.4. When income increases to $6,000, consumption is
(Multiple Choice)
4.9/5 (34)
Refer to the information provided in Figure 8.2 below to answer the questions that follow. 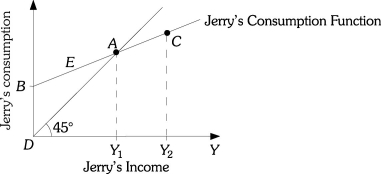 Figure 8.2
-Refer to Figure 8.2. Positive saving occurs along the line segment
Figure 8.2
-Refer to Figure 8.2. Positive saving occurs along the line segment
(Multiple Choice)
4.8/5 (39)
Refer to the information provided in Figure 8.4 below to answer the questions that follow. 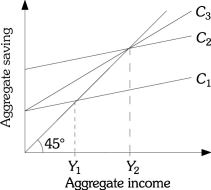 Figure 8.4
-Refer to Figure 8.4. If income is Y1, aggregate consumption is the smallest when the aggregate consumption function is
Figure 8.4
-Refer to Figure 8.4. If income is Y1, aggregate consumption is the smallest when the aggregate consumption function is
(Multiple Choice)
4.8/5 (32)
Refer to the information provided in Figure 8.8 below to answer the questions that follow. 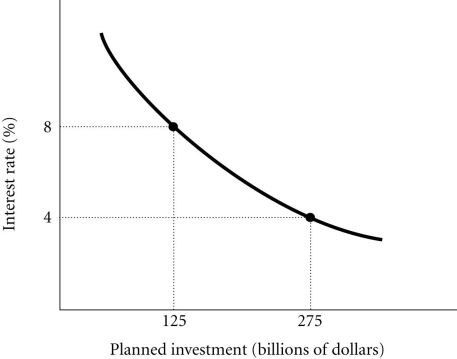 Figure 8.8
-Refer to Figure 8.8. The amount of planned investment ________ if the interest rate falls from 8% to 4%.
Figure 8.8
-Refer to Figure 8.8. The amount of planned investment ________ if the interest rate falls from 8% to 4%.
(Multiple Choice)
4.8/5 (37)
Refer to the information provided in Table 8.10 below to answer the questions that follow.
Table 8.10 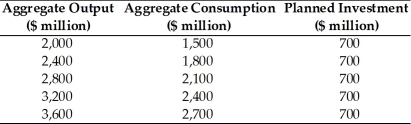 -Refer to Table 8.10. The equilibrium level of aggregate output equals
(Multiple Choice)
4.7/5 (37)
The fraction of a change in income that is consumed or spent is called
(Multiple Choice)
4.9/5 (42)
Refer to the information provided in Figure 8.7 below to answer the questions that follow. 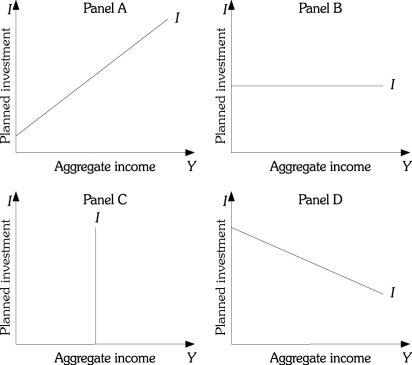 Figure 8.7
-Refer to Figure 8.7. In Ichabodia, planned investment varies directly with income. Ichabodia's planned investment function is represented by
Figure 8.7
-Refer to Figure 8.7. In Ichabodia, planned investment varies directly with income. Ichabodia's planned investment function is represented by
(Multiple Choice)
4.8/5 (32)
Refer to the information provided in Figure 8.11 below to answer the questions that follow. Figure 8.11
-Refer to Figure 8.11. On this graph, 4 represents the
(Multiple Choice)
4.8/5 (25)
Refer to the information provided in Table 8.10 below to answer the questions that follow.
Table 8.10
-Refer to Table 8.10. Planned investment equals actual investment at
(Multiple Choice)
4.8/5 (35)
Refer to the information provided in Figure 8.1 below to answer the questions that follow. 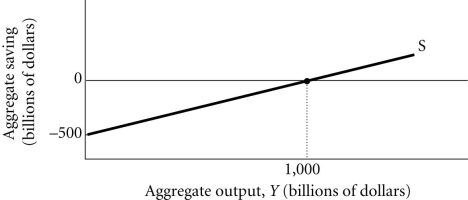 Figure 8.1
-Refer to Figure 8.1. An increase in the MPC
Figure 8.1
-Refer to Figure 8.1. An increase in the MPC
(Multiple Choice)
4.7/5 (43)
Refer to the information provided in Figure 8.6 below to answer the questions that follow. 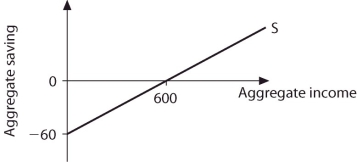 Figure 8.6
-Refer to Figure 8.6. Aggregate consumption is 960 when aggregate income is
Figure 8.6
-Refer to Figure 8.6. Aggregate consumption is 960 when aggregate income is
(Multiple Choice)
4.8/5 (29)
Refer to the information provided in Table 8.8 below to answer the questions that follow.
Table 8.8 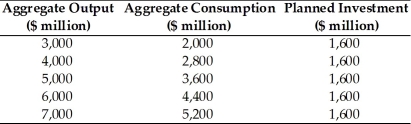 -Refer to Table 8.8. At an aggregate output level of $4,000 million, the unplanned inventory change is
(Multiple Choice)
4.9/5 (40)
If the consumption function is of the form [C = 60 + 0.9Y], the MPS equals
(Multiple Choice)
4.8/5 (32)
If autonomous consumption increases, the size of the multiplier would
(Multiple Choice)
4.9/5 (38)
Filters
- Essay(0)
- Multiple Choice(0)
- Short Answer(0)
- True False(0)
- Matching(0)