Exam 13: Macroeconomic Policy and Aggregate Demand and Supply Analysis
Exam 1: The Policy and Practice of Macroeconomics82 Questions
Exam 2: Measuring Macroeconomic Data85 Questions
Exam 3: Aggregate Production and Productivity85 Questions
Exam 4: Saving and Investment in Closed and Open Economies85 Questions
Exam 5: Money and Inflation91 Questions
Exam 6: The Sources of Growth and the Solow Model86 Questions
Exam 7: Drivers of Growth: Technology, policy, and Institutions85 Questions
Exam 8: Business Cycles: an Introduction88 Questions
Exam 9: The Is Curve97 Questions
Exam 10: Monetary Policy and Aggregate Demand86 Questions
Exam 11: Aggregate Supply and the Phillips Curve85 Questions
Exam 12: The Aggregate Demand and Supply Model89 Questions
Exam 13: Macroeconomic Policy and Aggregate Demand and Supply Analysis100 Questions
Exam 14: The Financial System and Economic Growth85 Questions
Exam 15: Financial Crises and the Economy92 Questions
Exam 16: Fiscal Policy and the Government Budget92 Questions
Exam 17: Exchange Rates and International Economic Policy90 Questions
Exam 18: Consumption and Saving87 Questions
Exam 19: Investment74 Questions
Exam 20: The Labor Market, employment, and Unemployment88 Questions
Exam 21: The Role of Expectations in Macroeconomic Policy86 Questions
Exam 22: Modern Business Cycle Theory77 Questions
Select questions type
If the economy is in a long-run equilibrium when the Federal Reserve decides that its inflation target is too low and chooses to raise it,________.
(Multiple Choice)
4.9/5  (35)
(35)
Figure 13.1 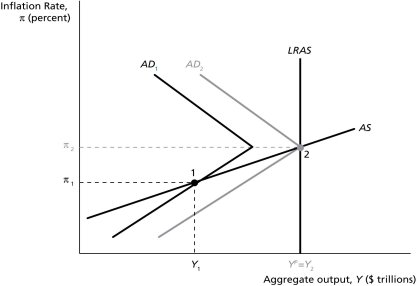 -If the economy is at point 1 in Figure 13.1 and there is no policy intervention,what happens next?
(Multiple Choice)
4.8/5 (31)
If the inflation rate target is 2%,the current inflation rate is 1%,and the output gap is minus 2%,then according to the Taylor rule,the nominal federal funds rate should be ________ percent.
(Multiple Choice)
4.8/5 (37)
How might strict adherence to the Taylor rule discourage demand-pull inflation? How might demand-pull inflation occur,nonetheless?
(Essay)
4.7/5 (40)
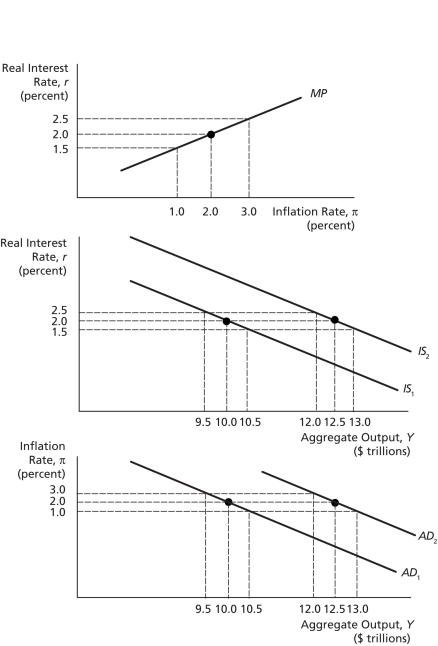 -In the figure above,assume that output is $10.5 trillion,while potential output is $12 trillion.If there is no policy intervention,we should expect ________.
(Multiple Choice)
4.9/5 (49)
When a temporary negative supply shock hits the economy,then in the short-run ________.
(Multiple Choice)
4.8/5 (32)
Which of the following is a likely objective of monetary policy?
(Multiple Choice)
5.0/5 (34)
-In the figure above,assume that output is $10.5 trillion,while potential output is $12 trillion.Suppose that a combination of fiscal stimulus and recovery of consumer and business confidence shifts the IS and AD curves,as shown in the figure.The equilibrium real interest rate is ________ percent.
(Multiple Choice)
4.9/5 (36)
If the economy is in a long-run equilibrium when the Federal Reserve decides that its inflation target is too low and chooses to raise it,________.
(Multiple Choice)
4.8/5 (34)
The time it takes for policymakers to obtain and to understand the data and to change the policy instrument based on that information is known as ________,respectively.
(Multiple Choice)
4.7/5 (33)
In recent decades,the trend among central banks has been to adopt ________.
(Multiple Choice)
4.8/5 (44)
Many borrowers defaulted on subprime mortgages ultimately disrupting financial markets by August 2007.Which of the following is a likely result of this increase in financial frictions?
(Multiple Choice)
4.8/5 (33)
How might openness to the global economy influence the debate between policy activists and nonactivists?
(Essay)
5.0/5 (38)
Ceteris Paribus,if current output has fallen below potential ________.
(Multiple Choice)
4.8/5 (40)
If the economy is in a long-run equilibrium when the Federal Reserve decides that its inflation target is too low and chooses to raise it,________.
(Multiple Choice)
4.8/5 (38)
Suppose that data for a particular economy over time suggest that its aggregate demand curve is both steep and shifts frequently.We might reasonably infer that ________.
(Multiple Choice)
4.8/5 (42)
Figure 13.1
-The aggregate demand curves in Figure 13.1 have a positively-sloped portion.The reason this can happen is ________.
(Multiple Choice)
4.9/5 (44)
Is the Taylor rule of greater use to activist or to nonactivist policy makers?
(Essay)
4.8/5 (33)
-In the figure above,assume that output is $10.5 trillion,while potential output is $12 trillion.If autonomous monetary policy (alone)is used to bring output to $12 trillion,then the figure implies that the real interest rate will be ________ percent,and the inflation rate will be one percent.
(Multiple Choice)
4.7/5 (30)
Filters
- Essay(0)
- Multiple Choice(0)
- Short Answer(0)
- True False(0)
- Matching(0)