Exam 7: Demand Estimation and Forecasting
Exam 1: Managers, profits, and Markets30 Questions
Exam 2: Demand, supply, and Market Equilibrium64 Questions
Exam 3: Marginal Analysis for Optimal Decision Making96 Questions
Exam 4: Basic Estimation Techniques19 Questions
Exam 5: Theory of Consumer Behavior69 Questions
Exam 6: Elasticity and Demand77 Questions
Exam 7: Demand Estimation and Forecasting65 Questions
Exam 8: Production and Cost in the Short Run100 Questions
Exam 9: Production and Cost in the Long Run89 Questions
Exam 10: Production and Cost Estimation55 Questions
Exam 11: Managerial Decisions in Competitive Markets90 Questions
Exam 12: Managerial Decisions for Firms With Market Power110 Questions
Exam 13: Strategic Decision Making in Oligopoly Markets42 Questions
Exam 14: Advanced Pricing Techniques57 Questions
Exam 15: Decisions Under Risk and Uncertainty60 Questions
Exam 16: Government Regulation of Business50 Questions
Select questions type
a.complements since the coefficient on M is positive.
b.substitutes since the coefficient on M is positive.
c.complements since the coefficient on  is positive.
d.substitutes since the coefficient on
is positive.
d.substitutes since the coefficient on  is positive.
-The estimated demand for a good is
is positive.
-The estimated demand for a good is 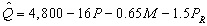 where Q is the quantity demanded of the good,P is the price of the good,M is income,and
  is the price of related good R.This good and good R are
(Multiple Choice)
4.9/5  (38)
(38)
Build-Right Concrete Products produces specialty cement used in construction of highways.Build-Right is a price-setting firm and estimates the demand for its cement by the State Highway Department using a demand function in the nonlinear form:  where Q = yards of cement demanded monthly,P = the price of Build-Right's cement per yard,M = state tax revenues per capita,and
  = the price of asphalt per yard.The manager at Build-Right transforms the nonlinear relation into a linear relation for estimation.The estimation results are presented below:
  Given the above,the estimated cross-price elasticity of demand for cement relative to the price of asphalt is
(Multiple Choice)
4.8/5 (28)
A consulting firm estimates the following quarterly sales forecasting model:  The equation is estimated using quarterly data from 2005I-2015III t = 1,...,43).The variable D is a dummy variable for the second quarter where: D = 1 in the second quarter,and 0 otherwise.
The results of the estimation are:
The equation is estimated using quarterly data from 2005I-2015III t = 1,...,43).The variable D is a dummy variable for the second quarter where: D = 1 in the second quarter,and 0 otherwise.
The results of the estimation are:
 Given the above,what is the estimated intercept of the trend line in the second quarter?
(Multiple Choice)
4.7/5 (35)
A forecaster used the regression equation 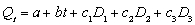 and quarterly sales data for 1996I-2013IV t = 1,...,64)for an appliance manufacturer to obtain the results shown below.Q is quarterly sales,and
  and
and  are dummy variables for quarters I,II,and III.
  At the 5 percent level of significance,is there a statistically significant trend in sales?
(Multiple Choice)
4.7/5 (30)
The following linear demand specification is estimated for Conlan Enterprises,a price-setting firm: 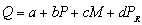 where Q is the quantity demanded of the product Conlan Enterprises sells,P is the price of that product,M is income,and
  is the price of a related product.The results of the estimation are presented below:
  Given the above,at the 1% level of significance,which estimates are statistically significant?
(Multiple Choice)
4.8/5 (27)
If demand is estimated using the empirical specification 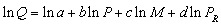 ,then an equivalent expression for demand is
(Multiple Choice)
4.9/5 (38)
A consulting firm estimates the following quarterly sales forecasting model:  The equation is estimated using quarterly data from 2005I-2015III t = 1,...,43).The variable D is a dummy variable for the second quarter where: D = 1 in the second quarter,and 0 otherwise.
The results of the estimation are:
The equation is estimated using quarterly data from 2005I-2015III t = 1,...,43).The variable D is a dummy variable for the second quarter where: D = 1 in the second quarter,and 0 otherwise.
The results of the estimation are:
 Given the above,these estimates indicate that the second quarter change in sales is
(Multiple Choice)
4.8/5 (35)
The manufacturer of Beanie Baby dolls used quarterly price data for 2005I - 2013IV t = 1,...,36)and the regression equation  to forecast doll prices in the year 2014.
  is the quarterly price of dolls,and
  and
and  are dummy variables for quarters I,II,and III,respectively.
  The estimated QUARTERLY increase in price is ______,and the estimated ANNUAL increase in price is ______ .
(Multiple Choice)
4.7/5 (29)
a.complements since the coefficient on M is positive.
b.substitutes since the coefficient on M is positive.
c.complements since the coefficient on is positive.
d.substitutes since the coefficient on is positive.
-estimated demand for a good is  where Q is the quantity demanded of the good,P is the price of the good,M is income,and
  is the price of related good R.If the price of the good falls by $4,the quantity demanded will ________ by ________ units.
(Multiple Choice)
4.9/5 (31)
The following linear demand specification is estimated for Conlan Enterprises,a price-setting firm:  where Q is the quantity demanded of the product Conlan Enterprises sells,P is the price of that product,M is income,and
  is the price of a related product.The results of the estimation are presented below:
  For the next 2 questions suppose income remains at $10,000 but the price of the related good increases to $60 and Conlan decides to raise the price of its product to $50.What is the new own price elasticity of demand?
(Multiple Choice)
4.9/5 (24)
estimated demand for a good is  where Q is the quantity demanded of the good,P is the price of the good,M is income,and
  is the price of related good R.This good and the related good R are
(Multiple Choice)
4.9/5 (32)
A consulting firm estimates the following quarterly sales forecasting model:  The equation is estimated using quarterly data from 2005I-2015III t = 1,...,43).The variable D is a dummy variable for the second quarter where: D = 1 in the second quarter,and 0 otherwise.
The results of the estimation are:
The equation is estimated using quarterly data from 2005I-2015III t = 1,...,43).The variable D is a dummy variable for the second quarter where: D = 1 in the second quarter,and 0 otherwise.
The results of the estimation are:
 Given the above,what is the estimated intercept of the trend line in the third quarter?
(Multiple Choice)
5.0/5 (41)
A forecaster used the regression equation  and quarterly sales data for 1996I-2013IV t = 1,...,64)for an appliance manufacturer to obtain the results shown below.Q is quarterly sales,and
  and
and  are dummy variables for quarters I,II,and III.
  Using the estimation results given above,the predicted level of sales in 2014II is _______ units.
(Multiple Choice)
4.8/5 (40)
The manufacturer of Beanie Baby dolls used quarterly price data for 2005I - 2013IV t = 1,...,36)and the regression equation  to forecast doll prices in the year 2014.
  is the quarterly price of dolls,and
  and
and  are dummy variables for quarters I,II,and III,respectively.
  What is the estimated intercept of the trend line in the 4th quarter?
(Multiple Choice)
5.0/5 (37)
A consulting firm estimates the following quarterly sales forecasting model:  The equation is estimated using quarterly data from 2005I-2015III t = 1,...,43).The variable D is a dummy variable for the second quarter where: D = 1 in the second quarter,and 0 otherwise.
The results of the estimation are:
The equation is estimated using quarterly data from 2005I-2015III t = 1,...,43).The variable D is a dummy variable for the second quarter where: D = 1 in the second quarter,and 0 otherwise.
The results of the estimation are:
 Given the above,at the 1 percent level of significance,is there a statistically significant trend in sales?
(Multiple Choice)
4.8/5 (36)
Build-Right Concrete Products produces specialty cement used in construction of highways.Build-Right is a price-setting firm and estimates the demand for its cement by the State Highway Department using a demand function in the nonlinear form:  where Q = yards of cement demanded monthly,P = the price of Build-Right's cement per yard,M = state tax revenues per capita,and
  = the price of asphalt per yard.The manager at Build-Right transforms the nonlinear relation into a linear relation for estimation.The estimation results are presented below:
  Given the above,if Build-Right decides to charge the State Highway Department $55 per yard for its cement when tax revenues per capita are $3,200 and the price of asphalt is $35 per yard,the expected quantity demanded is
(Multiple Choice)
4.8/5 (35)
Filters
- Essay(0)
- Multiple Choice(0)
- Short Answer(0)
- True False(0)
- Matching(0)