Exam 7: Demand Estimation and Forecasting
Exam 1: Managers, profits, and Markets30 Questions
Exam 2: Demand, supply, and Market Equilibrium64 Questions
Exam 3: Marginal Analysis for Optimal Decision Making96 Questions
Exam 4: Basic Estimation Techniques19 Questions
Exam 5: Theory of Consumer Behavior69 Questions
Exam 6: Elasticity and Demand77 Questions
Exam 7: Demand Estimation and Forecasting65 Questions
Exam 8: Production and Cost in the Short Run100 Questions
Exam 9: Production and Cost in the Long Run89 Questions
Exam 10: Production and Cost Estimation55 Questions
Exam 11: Managerial Decisions in Competitive Markets90 Questions
Exam 12: Managerial Decisions for Firms With Market Power110 Questions
Exam 13: Strategic Decision Making in Oligopoly Markets42 Questions
Exam 14: Advanced Pricing Techniques57 Questions
Exam 15: Decisions Under Risk and Uncertainty60 Questions
Exam 16: Government Regulation of Business50 Questions
Select questions type
The manufacturer of Beanie Baby dolls used quarterly price data for 2005I - 2013IV t = 1,...,36)and the regression equation 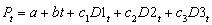 to forecast doll prices in the year 2014.
  is the quarterly price of dolls,and
  and
and  are dummy variables for quarters I,II,and III,respectively.
  At the 2 percent level of statistical significance,the estimation results indicate that price in the ________ quarter is significantly higher than in any other quarter.
(Multiple Choice)
5.0/5  (39)
(39)
A forecaster used the regression equation 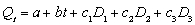 and quarterly sales data for 1996I-2013IV t = 1,...,64)for an appliance manufacturer to obtain the results shown below.Q is quarterly sales,and
  and
and  are dummy variables for quarters I,II,and III.
  At the 5 percent level of significance,is there a statistically significant trend in sales?
(Multiple Choice)
4.8/5 (37)
Build-Right Concrete Products produces specialty cement used in construction of highways.Build-Right is a price-setting firm and estimates the demand for its cement by the State Highway Department using a demand function in the nonlinear form:  where Q = yards of cement demanded monthly,P = the price of Build-Right's cement per yard,M = state tax revenues per capita,and
  = the price of asphalt per yard.The manager at Build-Right transforms the nonlinear relation into a linear relation for estimation.The estimation results are presented below:
  Given the above,the estimated demand for cement is
(Multiple Choice)
4.9/5 (32)
Filters
- Essay(0)
- Multiple Choice(0)
- Short Answer(0)
- True False(0)
- Matching(0)