Multiple Choice
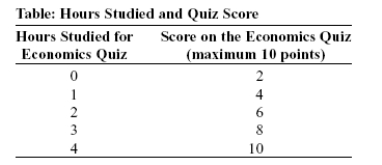
(Table: Hours Studied and Quiz Score) Use Table: Hours Studied and Quiz Score.The table shows data for students in an economics class.If we were to graph these data and draw a line through the points,we would choose _____ to be the independent variable;the vertical intercept of our line would be _____;and the slope of our line would be _____. 
A) quiz score;y = 2;-2
B) quiz score;x = 0;-2
C) hours studied;y = 0;+2
D) hours studied;y = 2;+2
Correct Answer:

Verified
Correct Answer:
Verified
Q1: On a two-dimensional graph representing two variables:<br>A)a
Q3: Use the following to answer question:<br><img src="https://d2lvgg3v3hfg70.cloudfront.net/TB6643/.jpg"
Q4: A pie chart is used to depict
Q5: If two variables are positively related,on a
Q6: The point at which the axes of
Q7: The _ of a curve shows the
Q8: In a time-series graph,large changes can be
Q9: Use the following to answer question: <img
Q10: Use the following to answer question: <img
Q11: Use the following to answer question:<br><img src="https://d2lvgg3v3hfg70.cloudfront.net/TB6643/.jpg"