True/False
Use the following to answer question: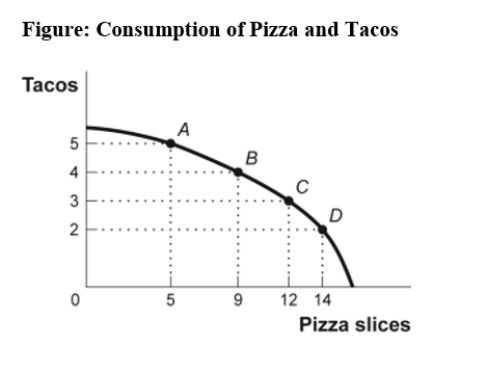
-(Figure: Consumption of Pizza and Tacos)Use Figure: Consumption of Pizza and Tacos.The figure shows the number of tacos and pizza slices Matt can eat in a day.The relation is nonlinear,and there is a negative relation between the number of tacos and pizza slices that Matt can eat in a day.
Correct Answer:

Verified
Correct Answer:
Verified
Q1: On a two-dimensional graph representing two variables:<br>A)a
Q2: (Table: Hours Studied and Quiz Score)Use Table:
Q4: A pie chart is used to depict
Q5: If two variables are positively related,on a
Q6: The point at which the axes of
Q7: The _ of a curve shows the
Q8: In a time-series graph,large changes can be
Q9: Use the following to answer question: <img
Q10: Use the following to answer question: <img
Q11: Use the following to answer question:<br><img src="https://d2lvgg3v3hfg70.cloudfront.net/TB6643/.jpg"