Multiple Choice
Table 15-1
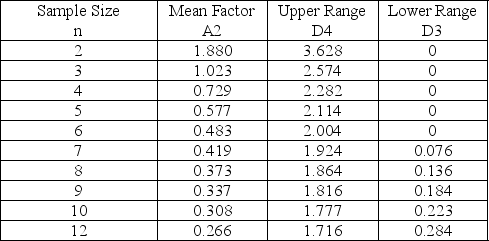
-Refer to Table 15-1.Bags of chocolate candy are sampled to ensure proper weight.The overall average for the samples is 36 ounces.Each sample contains twelve bags.The average range is 1.3 ounces.The upper control chart limit for the sample averages would be
A) 36.3458.
B) 35.6542.
C) 38.3101.
D) 36.6279.
Correct Answer:

Verified
Correct Answer:
Verified
Q17: TQM emphasizes quality of the goods or
Q18: If all of the control points on
Q19: A quality control program is being developed
Q20: A company has been receiving complaints about
Q21: Robert Pirsig defines quality as "Fitness for
Q23: Table 15-1<br> <img src="https://d2lvgg3v3hfg70.cloudfront.net/TB5481/.jpg" alt="Table 15-1
Q24: The area from two standard deviations above
Q25: Which of the following control charts is/are
Q26: Explain the difference between an x-bar chart
Q27: A company has been receiving complaints about